Open Access
Fig. 2.
Download original image
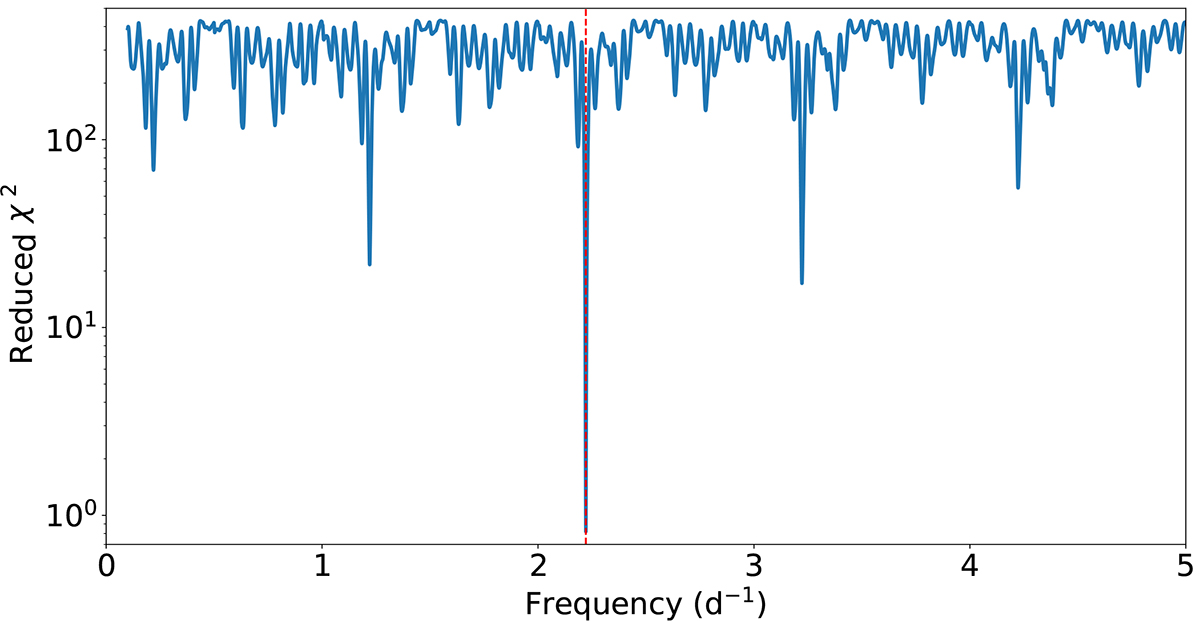
Reduced χ2 periodogram of the radial-velocity curve generated from the cross-correlation with HD 219134 (K3/4V). The best-fitting period is marked with a dashed red line. Note the logarithmic scale in the y axis.
Current usage metrics show cumulative count of Article Views (full-text article views including HTML views, PDF and ePub downloads, according to the available data) and Abstracts Views on Vision4Press platform.
Data correspond to usage on the plateform after 2015. The current usage metrics is available 48-96 hours after online publication and is updated daily on week days.
Initial download of the metrics may take a while.