| Issue |
A&A
Volume 693, January 2025
|
|
|---|---|---|
| Article Number | A79 | |
| Number of page(s) | 7 | |
| Section | Interstellar and circumstellar matter | |
| DOI | https://doi.org/10.1051/0004-6361/202451957 | |
| Published online | 03 January 2025 | |
Two-epoch spectral imagery of the outflow system PV Cep
1
Byurakan Astrophysical Observatory NAS Armenia,
Byurakan, Aragatsotn prov.
0213,
Armenia
2
Special Astrophysical Observatory, N.Arkhyz,
Karachaevo-Cherkesia
369167,
Russia
★ Corresponding authors; This email address is being protected from spambots. You need JavaScript enabled to view it.
; This email address is being protected from spambots. You need JavaScript enabled to view it.
; This email address is being protected from spambots. You need JavaScript enabled to view it.
Received:
22
August
2024
Accepted:
27
November
2024
Abstract
Context. We continue to study the structure and kinematics of Herbig-Haro (HH) flows. HH flows exhibit a large variety of morphological and kinematical structures. Proper motion (PM) and radial velocity investigations are essential for understanding the physical nature of these structures.
Aims. We investigated the kinematics and PM of spectrally separated structures in the PV Cep HH flow HH 215.
Methods. We present observational results we obtained with a 6 m telescope (in Russia) using the SCORPIO multi-mode focal reducer with a scanning Fabry-Perot interferometer. Two epochs of the observations of the PV Cep region in Hα and [SII] emission (2003 and 2020–2021) allowed us to study the morphology of the HH 215 jet in detail and to measure the PM and radial velocities for its inner structures.
Results. We studied previously known emission knots in the HH 215 flow and new features. Moreover, a newly formed HH knot was revealed. It presumably formed during the large maximum of PV Cep in 1976–1977. We found the high-velocity inner channel in the HH 215 ionized outflow, oriented in the mean direction of the whole HH outflow, and the symmetry axis of the reflection nebula. The position angle of the HH knots located along the axis of the high-velocity channel coincide with its axis (about 325°), but others have a completely different value (about 25°). This supports the idea that these knots were formed by oblique shocks. We derived a value of i ≈ 30° ± 5° for the inclination angle between the flow axis and the line of sight. The total length of the HH 215 outflow probably is about 0.2 pc, and the full length of the bipolar outflow from PV Cep (HH 315 + HH 215) can be estimated as 3.6 pc, assuming that the inclination angle is approximately stable.
Key words: stars: individual: PV Cep / stars: pre-main sequence / Herbig-Haro objects / ISM: jets and outflows
© The Authors 2025
 Open Access article, published by EDP Sciences, under the terms of the Creative Commons Attribution License (https://creativecommons.org/licenses/by/4.0), which permits unrestricted use, distribution, and reproduction in any medium, provided the original work is properly cited.
This article is published in open access under the Subscribe to Open model. This email address is being protected from spambots. You need JavaScript enabled to view it. to support open access publication.
1 Introduction
The star PV Cep is one of the most remarkable eruptive pre-main-sequence objects. It is located at the northeastern edge of the L 1158 and L 1155 groups of dark clouds, 1.5° east of the famous NGC 7023 nebula. Its distance can be obtained from the Gaia DR3 catalog parallax and is 356 pc. This value can be compared with the quite similar estimate (343 pc) by Vioque et al. (2018), which was based on the parallax from Gaia DR2. For simplicity, we assumed 350 pc to be the distance to PV Cep in the further analysis. This distance associates this object with the Cepheus Flare star-forming region (Kun et al. 2008).
This object was discovered in the period of its most powerful outburst in 1976 by Gyulbudagyan et al. (1977) and Cohen et al. (1977), when its brightness rose for 5 magnitudes in the red (Cohen et al. 1981). Since then, this star underwent several subsequent maxima with various amplitudes and durations; several previous outbursts that went unnoticed were found (Kun et al., unpublished; Andreasyan et al. 2021).
PV Cep is associated with the reflection nebula that is highly variable in brightness and morphology. This nebula has a roughly conical shape and is known as GM 1-29 (Gyulbudagyan & Magakyan 1977) or RNO 125 (Cohen 1980). Deep CCD images of this object reveal a faint red counterfan that proves its bipolar structure (Levreault & Opal 1987). Recent changes in the shape of the nebula were shown by Kun et al. (2011).
The highly variable spectrum of PV Cep corresponds to a very active T Tau star and contains a great number of permitted and forbidden emission lines; several of them are split into many components. It was studied in detail in many works (see, e.g. Caratti o Garatti et al. 2013; Giannini et al. 2022). At first PV Cep was assigned to the EX Lupi class (EXors) that was introduced by Herbig (1977, 1989), but was later eliminated by him from the list because further studies revealed too many significant differences between PV Cep and typical EXors. Several authors related this object to eruptive stars, which are intermediate between FUors and EXors (Andreasyan et al. 2021).
Like the majority of PMS stars with eruptive activity, PV Cep was found to be the source of directed outflows. Its bipolar molecular outflow was found by Levreault (1984). The blueshifted lobe of this outflow coincides with the axis of the reflection nebula, and the redshifted lobe is associated with the faint counterfan. PV Cep was also detected as a source of centimeter radio continuum (Anglada et al. 1992), which certainly comes from the accretion disk near the star.
The association of PV Cep with an ionized Herbig-Haro (HH) outflow also was found. Neckel et al. (1987) detected two HH emission knots via spectral observations. The knots are projected on the reflection nebula. One of them was also found in narrow-band images (Ray 1987). These same knots were rediscovered and described by Reipurth et al. (1997) and Gomez et al. (1997). They are known today as HH 215. The existence of the giant (i.e. parsec-sized) bipolar HH outflow from PV Cep, which was numbered HH 315, was also revealed (Gomez et al. 1997; Reipurth et al. 1997). It exhibits a clear S-shaped point symmetry of the blue and red lobes, suggesting precession of the source (Reipurth et al. 1997). All knots of this outflow lie within the lobes of the molecular outflow.
Although the PV Cep system is still the subject of many studies, the structure and kinematics of its collimated outflow, especially near the star (i.e.. HH 215), where the influence of the bright reflection nebula is strong, remained little studied. We focused here on the nearby outflow system.
Our observations were carried out with Fabry-Pérot scanning interferometry (FPI) technique in the Hα and [S II] 6716 Å emission lines. The HH 215 region was fully covered. Similar to other 3D methods, FP scanning interferometry provides detailed spectrophotometric information and a full spatial coverage, but the spectral range is usually limited to one spectral line. However, its distinct advantage is the wide field of view, combined with a high spectral resolution, which is ideal for studying extended emission objects such as HH jets. To obtain the full three-dimensional picture of the jet kinematics, we also measured the proper motions of all knots where such measurements were possible.
2 Observations and data reduction
Observations were carried out in the prime focus of the 6 m telescope of the Special Astrophysical Observatory (SAO) of the Russian Academy of Sciences in two epochs: on 25 May 2003 and on 29 December 2021 (in [S II] 6716Å emission) and 8 December 2020 (in Hα emission) in good conditions (the seeing was about 2″). The scanning FPI was placed in the parallel beam of the Spectral Camera with Optical Reducer for Photometric and Interferometric Observations (SCORPIO; in 2003) and SCORPIO-2 (in 2020–21) multimode focal reducers. These devices were described in Afanasiev & Moiseev (2005) and Afanasiev & M oiseev (2011), and their capabilities in the scanning FPI observational mode were reviewed in Moiseev (2021).
The detector used during the first epoch of observations was an EEV 42-40 2048×2048 pixel CCD array. Observations were performed with a 4×4 pixel binning to reduce the readout time and readout noises, that is, 512×512 pixel images were obtained in each spectral channel. The field of view was 5.3′ and the scale was 0.62″ per pixel.
The scanning interferometer used in these observations was the Queensgate ET-50, which operates in the 501st order of interference in the Hα wavelength. It provides a spectral resolution of FWHM≈ 0.8 Å (or ≈40 km s−1) for a range of Δλ=13 Å (or ≈590 km s−1) free from order overlapping. The number of spectral channels was 36, and the size of a single channel was Δλ ≈ 0.36 Å (≈16 km s−1). The exposure time was 200 seconds per channel, and the total exposure time was 7200 s.
During the second-epoch observations in 2020 with SCORPIO-2, the detector was an E2V 42-90 4612 × 2048 pixel CCD array. Observations were performed with a 2 × 2 pixel binning in a central square of the CCD array, so that 1024×1024 pixel images were obtained in each spectral channel. The field of view was 6.1′ for a scale of 0.36″ per pixel. The total exposure was 7200 seconds.
In 2021, the detector was an E2V 261-84 4096×2048 pixel CCD array. Observations were performed with a 2×2 pixel binning in a central square of the CCD array, so that 1024×1024 pixel images were obtained in each spectral channel. The field of view was 6.4′ for a scale of 0.4″ per pixel. The total exposure was 6000 seconds.
The two second-epoch SCORPIO-2 observations were performed with the ICOS scanning FPI, which operates in the 751st order of interference at the Hα wavelength and provides a spectral resolution with an FWHM ≈ 0.4 Å (or ≈20 km s−1) for a range of Δλ=8.7 Å (or ≈390 km s−1) without order overlapping. The number of spectral channels was 40, and the size of a single channel was Δλ ≈ 0.22 Å (≈10 km s−1).
In the first epoch, only the observations in the [S II] 6716 Å line were carried out; in the second epoch, both [S II] 6716 Å and Hα lines were observed. In all cases, the interference filters with FWHM = 15 Å, centered on the Hα and [S II] 6716 Å lines, were used for the pre-monochromatization.
We reduced our interferometric observations using the software developed at the SAO (Moiseev & Egorov 2008; Moiseev 2021) and the ADHOC software package1. After primary data reduction, subtraction of night-sky lines, photometric correction, and wavelength calibration, the observational material was stored in data cubes. The final data cubes were subjected to optimal data filtering, which included Gaussian smoothing over the spectral coordinate with FWHM = 1.5 channels and spatial smoothing by a two-dimensional Gaussian with FWHM = 2–3 pixels.
Using these data cubes, we spectrally separated the structures in the outflow system. Then the PM were measured for the selected structures using observations in both epochs. To estimate the PM, we used a method of two images that were optimally offset by means of a cross-correlation (realized as the procedure CORREL_IMAGES by F. Varosi and included in the IDL astronomy library2).
3 Results
3.1 Morphology of the outflow
Our observations cover a field of view of about 6′ that includes only the knots of HH 215 system, which is the initial part of the giant outflow HH 315. No detailed description of the morphology of HH 215 exists so far. The lack of investigations is related to the difficulties of detecting the faint emission structures against the bright background of the variable reflection nebula near PV Cep.
As we described above, during the observations with the Fabry-Pérot interferometer in 2003, we only scanned the [S II] 6716 Å line because t he reflection nebula was very bright in both the continuum and the Hα emission because the source star was maximally bright. During the second-epoch observations, PV Cep was at the minimum of its brightness, and its reflection nebula was only barely visible. We took these circumstances into account and decided to scan the [S II] 6716 Å and Hα lines both.
Fig. 1 presents the superposition of the integrated images in the monochromatic [S II] 6716 Å line emission (gray scale) and continuum (contours), restored from FPI observations in 2003. The cone-shaped morphology of the reflection nebula and the wiggling structure of the emission jet are clearly visible.
The second-epoch observations in Hα (Fig. 2, left panel) revealed the complex morphology of the HH 215 flow, which consists of the several well-defined knots. We denote them by letters, starting from the source star. Knot D can be identified with the first emission patch (P1) described by Neckel et al. (1987), and knot G is the second patch (P2), also detected by Ray (1987). The correspondence between our knots and those listed by Gomez et al. (1997) is the following: HH 215(1) is knot G, HH 215(2) is C, HH 215(3) and HH 215(4) are D, and HH 215(5) probably is knot E. In general, the HH 215 flow can be described as the wiggling jet near the source (knots A-F), which is advanced by the large arcuate structure (knots G-I). The images obtained in two epochs in [S II] 6716 Å emission are also presented in the same figure (central and right panels). The appearance of a new knot is specially noteworthy. This is knot A, and it lies at a distance of about 4″ from the source. Knot A became visible only in the second-epoch images. This knot is significantly brighter in [S II] 6716 Å than in Hα emission, but it is well discernible in both wavelengths. Yet another conspicuously bright knot in [S II] 6716 Å (marked F) that is only barely visible in the Hα image is also noted.
Proper motions and heliocentric radial velocities of the knots in the PV Cep outflow.
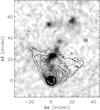 |
Fig. 1 Restored image of the PV Cep jet obtained from the 2003 observations with scanning FPI. Continuum-subtracted [S II] 6716 Å emission (gray scale) and the continuum image superposed (isolines). |
3.2 Radial velocities
The differences in the measured radial velocities between the two epoch observations do not exceed 5 km s−1 for knot D and are lower than 2 km s−1 for the other knots. Because of the higher spectral resolution, we concentrated our investigation on the radial velocities that were obtained in the second epoch; in any case, the average radial velocities in the PV Cep outflow are very high and vary around −300 km s−1. Here and below, by “high” and “low” velocities we mean their absolute values. Here and throughout, we also use heliocentric radial velocities.
A two-dimensional map of radial velocities reveals a high-velocity channel starting from the newly formed knot A and stretching up to knot I (Fig. 3). Structures with a lower velocity are located around this channel. Knots D and I, where two zones with different radial velocities are observed, are particularly interesting. When we take into account the direction of the flow in both cases, low-velocity structures are located ahead of higher-velocity structures. The integrated values of the heliocentric radial velocities in each knot of the outflow are presented in Table 1.
Our estimates of the radial velocities in the HH 215 jet are rather close to the values obtained by Caratti o Garatti et al. (2013) for the near-infrared forbidden emission lines of ionized iron in the spectrum of the source star PV Cep. These authors reported that these lines are split into four components, similar to other forbidden emissions in the PV Cep spectrum (see, e.g. Magakian & Movsessian 2001). We selected the values of the radial velocities of the blueshifted components (HVC-blue) from their Table A.1 and computed the mean velocity, which was equal to −265±3 km s−1. This should be compared with the mean radial velocity of the HH 215 knots (excluding knot G, which is located on the side of the main flow) in the Hα (−240±15 km s−1) and [S II] (−242±22 km s−1) emissions (we note that these last values are corrected to the local standard of rest, which was used by Caratti o Garatti et al. 2013).
To clarify the positions and values of the high- and low-velocity components, we generated two pseudo-slits based on the data cube obtained in 2020, along the position angles (PA) of 2° and 330° degrees and with a width of 2″. Fig. 4 shows the monochromatic image in Hα emission with the positions of the pseudo-slits and corresponding position-velocity (PV) diagrams in the Hα and [S II] 6716 Å lines. We used continuum-subtracted cubes to isolate the pure emission and to exclude the continuum of the source star and the star that is in projection near knot I. In the PV diagram, which corresponds to the first pseudo-slit (PA=2°), four knots and the bright and wide Hα emission from the source are discernible. We note that the Hα emission line in knot D is split into two components, with velocities of about −255 and −180 km s−1. In contrast, the [S II] 6716 Å emission in knot D is not split. Moreover, the newly formed knot A is clearly visible near the bright blueshifted Hα emission of the source star, but the pronounced decrease in the radial velocities with distance from the source in this knot is only visible in [S II] 6716 Å.
The second PV diagram, built on the basis of the pseudo-slit with PA=330°, includes five knots. It not only confirms the split of the Hα emission line in knot D, but also shows a similar split in knot I, with velocities of about −245 and −185 km s−1. These values are very close to those in knot D. In the [S II] 6716 Å emission, as in the previous case, the lines are not split and show only one component.
The regions with two distinct velocities are also spatially separated as well, which was observed before in the two-dimensional velocity field of the outflow system (Fig. 3). To show this even more clearly, we present in Fig. 5 the images of knots D and I, built in channels corresponding to a high radial velocity, and the images in low-velocity channels are superposed. More precisely, we used high-velocity channels, which correspond to −270 km s−1 for knot D and −255 km s−1 for knot I, and the low-velocity channels correspond to −175 km s−1 for both panels. The low-velocity structures are located ahead of the high-velocity structures for both knots. In the case of knot I, this effect seems typical for working surfaces, since the high-velocity structure is represented by a compact knot while an arcuate low-velocity structure circles it.
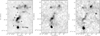 |
Fig. 2 Restored image obtained from the 2020 observations with the scanning FPI of the PV Cep outflow in Hα emission (left panel), and the continuum-subtracted [S II] 6716 Å images restored from FPI observations in 2003 (central panel) and in 2020 (right panel). |
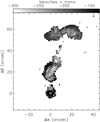 |
Fig. 3 Two-dimensional map of the radial velocities in the PV Cep outflow system obtained from 2003 FPI observations (gray scale). The monochromatic image in Hα emission is superposed (isolines). |
3.3 Proper motions
We used restored [S II] 6716 Å images that were obtained from FPI observations in two epochs to measure the proper motions (PM) of all detectable outflow structures. Unfortunately, we lack observations in Hα during the first epoch, and therefore, we were unable to measure the proper motion for structures with different radial velocities, which are seen only in Hα emission. As was described above, observations in two different epochs were carried out using different equipment and different detectors. To compare these data, the images were scaled spatially. We used field stars as reference points. The PM values were only measured for the features that correspond to the same radial velocity in both epochs because the inner structures of the PV Cep out-flow undergo strong morphological changes depending on the radial velocity. Thus, to achieve a better comparison of the morphological details, we created rebinned data cubes for the two epochs to bring them to the same velocity steps.
The results are presented in Table 1: the distances for each knot, measured from the central source (PV Cep), the values of the tangential velocities (computed for the distance of 350 pc), the PA, and also the radial velocities described in the previous section. Fig. 6 shows the PM vectors for the jet knots. Four knots are clearly located along the high radial velocity channel with a PA near 330°. The other knots have an angle near 25°.
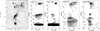 |
Fig. 4 Positions of the two pseudo-slits marked in the Hα image of the PV Cep outflow system (left panel) and the position-velocity diagrams for the Hα and [S II] 6716 Å lines, built from slit 1 (first two diagrams) and slit 2 (next two diagrams). |
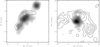 |
Fig. 5 High (gray scale) and low (isophotes) radial velocity structures in the Hα emission at knot D (left panel) and knot I (right panel). |
4 Discussion and conclusion
Before we consider the structure of the flow in detail, it is necessary to clarify its orientation. An obvious discrepancy exists in this question. In studies in the optical range (Reipurth et al. 1997; Gomez et al. 1997), the rather extended HH 315 flow resembles a helical structure, but is in general directed NNW (northern lobe). Thus, the PA of its axis is somewhat uncertain, but it is close to the symmetry axis of the reflection cometary nebula near PV Cep in any case. It also propagates fully in the limits of the northern lobe of the bipolar CO outflow (see Levreault 1984; Gomez et al. 1997). In the immediate neighborhood of PV Cep, that is, in the HH 215 knots, they follow the same direction in general, including their PM vectors (except for knots D and G).
However, the high spatial resolution millimeter observations (Hamidouche 2010) definitely contradict these arguments. According to the 1.3 mm data, the detected circumstellar disk of PV Cep has an inclination of 62° to the plane of sky, and the PA of the semimajor axis of its ellipse is 297°. Therefore, its rotation axis should have a PA = 27°. This value greatly differs from the mean direction of the HH 215 outflow (332° by PM vectors). The 2.7 mm data, however, do not confirm these estimates and show a nearly circular disk around PV Cep. An even stronger ambiguity arises when we consider the inner parts of the CO molecular outflow (mapped in the same work), which seems to propagate orthogonally to the circumstellar disk at first, but at a distance of about 25″ it turns clockwise and probably becomes more aligned with the HH 315 flow and its CO counterpart. However, these maps probably show the densest edges of the extended CO outflow (see the maps of Arce & Goodman 2002), and the very small beam filtered the main part of the outflow emission out. Thus, we assume 332° for PA and 30° for i (see next paragraph) as more credible values.
With approximately complete picture of the 3D kinematics of the HH 215 knots, we can directly derive the spatial orientation of the ionized flow. It is quite logical to use the knots for the computation that are located near the high-velocity channel, whose PM vectors also have nearly the same direction. These are B, E, F, and I. Deriving the mean values of Vr and Vt for them from the values from Table 1, we obtain i ≈ 30°± 5° for the inclination angle between the flow axis and the line of sight. Thus, the inclination of the circumstellar disk of PV Cep to the plane of the sky probably has the same value.
The close match of the radial velocities of the HH 215 knots and the jet in the immediate environment of PV Cep described in the previous section should be considered as confirmation that the flow as whole starts near the circumstellar disk and does not undergo noticeable changes in direction. Nevertheless, we should reconsider the full velocity of the northern branch of the ionized flow, which was estimated by Caratti o Garatti et al. (2013) to be about 600 km s−1 (but we recall that this estimate was based not only on their measured radial velocities, but also on the inclination angle derived from Hamidouche 2010). Taking into account our new data about tangential velocities, we obtain about 300 km s−1, which is quite typical for jet velocities and shows that our value for the inclination angle of the flow is much more consistent and the previous speed of the flow was grossly overestimated. Moreover, if the inclination estimated by Hamidouche (2010) were correct, the PM, corresponding to the tangential velocity of the northern branch of the outflow, would be much greater (about 500 km s−1) and would definitely exceed the observation errors of our measurements.
The morphology of the HH 215 outflow seems somewhat unusual in the sense that it is divided into two parts: the wiggling jet, and the preceding arcuate structure with an opening angle of about 40° toward the source. It is possible to deproject the observed emission structures and to obtain the morphology of the flow, how it would be visible if the flow axis coincided with the plane of the sky. This can be obtained by extending the dimensions along the axis by a factor of 1/sin 30° = 2. The result is shown in Fig. 7. The opening angle of the bow-shaped structure after the deprojection becomes about 15°, which is more typical for terminal working surfaces. The total length of the HH 215 outflow probably is about 0.2 pc, and the total length of the bipolar outflow from PV Cep (HH 315 + HH 215), estimated by Reipurth et al. (1997) for the distance of 500 pc as 2.6 pc in projection, for the newly estimated distance of PV Cep 350 pc is only about 3.6 pc, assuming that it approximately maintains the same inclination angle.
As the one of the most important results of this study we consider the discovery of the newly emerged emission knot (A) near the source in 2020 that was not visible in 2003. The formation of new knots in stellar jets is a well-known phenomenon (see, e.g., HH 1 jet (Hartigan et al. 2011) and HH 34 (Reipurth et al. 2002)). This can be considered as an indication that the sources continue to eject the matter episodically. Several new knots in the jet of Z CMa that are probably connected with episodic outbursts were detected by Whelan et al. (2010).
The projected distance of this newly formed knot from the source is about 4″, which at the distance of PV Cep (350 pc) is equal to ≈1400 a.u. Although the PM of knot A cannot be measured directly since it was not visible in the first epoch, we can assume the mean tangential velocity of B, F, E and I knots for knot A: ≈145 km s−1. Then the kinematic age of knot A can be derived as about 46 years. Considering the light curve of PV Cep, this age corresponds almost perfectly to the period of the maximum brightness of the source (1976–1978), when this star was discovered (Andreasyan et al. 2021). This makes the case of PV Cep the one of first observational proofs of the probable connection between the formation of HH jet knotty structures and the outbursts of the central source (Reipurth et al. 1997). Moreover, Caratti o Garatti et al. (2013) reported yet another knot just near the PV Cep star (1″) in the southern branch of the outflow. However, the new estimates of the distance of this star and of the jet inclination allow us to infer 1995 based on its kinematic age as the probable date of its formation; unfortunately, we do not know about any photometric observations in this period.
Another important step in the reconstruction of the morphology of HH 215 was that we revealed its complexity. It consists of the wiggling HH flow and a huge frontal bow-shaped structure. Since the first-epoch observations were performed when the PV Cep star and its associated reflection nebula were at maximum brightness, it was possible to combine the reconstructed image of the nebula in the continuum and the data in Hα to better understand the positions of the emission knots and the orientation of the flow against the cone-shaped reflection nebula. During the second-epoch observations, this flow was studied in Hα and [S II] 6716 Å emissions for the first time.
We also described the full kinematics of the HH 215 system for the first time, and we obtained the correct value of the jet inclination. In addition, the new data about the distance, jet velocity, and disk inclination should lead to a revision of the several stellar parameters, for example, of the luminosity and mass-loss rate of PV Cep. A reanalysis like this is beyond the scope of the present paper, however. In any case, the star will become more similar to EXors.
We revealed the high-velocity channel that passes through the center axis of the outflow and coincides with the trajectory of the giant outflow (Reipurth et al. 1997). As expected, it is directed along the axis of the reflection nebula and again proves the generic connection between the outflow and circumstellar disk, which causes the formation of the fan-shaped nebulae. Similar cases of entrained jets have been known for many years (see, e.g. Hartigan et al. 1993).
Detailed studies revealed two knots (D and I) whose Hα emission exhibits two regions that are separated both spatially and kinematically. The case of knot D appears more similar to the standard picture, in which a planar shock, embedded within a bow shock, is formed by an oblique shock when wiggling jets encounter cavity walls, because the high- and low-velocity components exhibit a similar morphology. According to Hartigan et al. (2011), this type of interaction must be common in stellar jets, where ejection angle variations of several degrees within a given jet are common.
The situation with knot I is different: The high-velocity component represents a compact structure, while the low-velocity component is more extended and has a bow-shaped morphology The high- and low-velocity structures in knot I probably represent the bow-shock and reverse shock in the internal working surfaces of the episodic outflow from PV Cep. This configuration of shocks is similar to the case of the HL Tau jet (Movsessian et al. 2012).
Two-epoch observations gave us the possibility to measure the PM of individual knots in the HH 215 system. In general, the knots have a high PM value that varies greatly from one knot to the next. A low PM is indicated in the huge bow-shape structure, where outflow material probably collides with the matter that was previously ejected with a lower velocity. The position angles of the PM vectors vary from one knot to the next. The PAs of the knots that are located along the axis of the high-velocity channel coincide with its axis (about 325°); the others have a completely different value (about 25°), which supports the idea that these knots were formed by oblique shocks. However, we did not find a single similar example in the literature in which PM of the knots belonging to the same jet show differences this large among each other, except for the cases of a significant interaction of the flows among each other or with the surrounding cavity walls (Movsessian et al. 2007; López et al. 2022; Massi et al. 2023). No evidence of this interaction was found in the HH 215 flow so far.
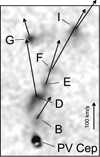 |
Fig. 6 Proper motions of the knots of the HH 215 outflow, shown by vectors. The scale of the vectors is indicated by the arrow at the right side of the panel. |
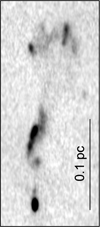 |
Fig. 7 Grayscale image of the HH 215 outflow in Hα, deprojected from Fig. 2a with a factor of 1/sini=2. |
Acknowledgements
We wish to thank the referee, Dr. Fabrizio Massi, for his very encouraging insights and comments. We are grateful to Dr. Dmitry Oparin and Dr. Roman Uklein who preformed SCORPIO-2 observations in 2020-21. We obtained the observed data on the unique scientific facility “Big Telescope Altazimuthal” of SAO RAS as well as made data reduction with the financial support of grant No075-15-2022-262 (13.MNPMU.21.0003) of the Ministry of Science and Higher Education of the Russian Federation. This work was supported by the RA MES State Committee of Science, in the frames of the research project number 21T-1C031.
References
- Afanasiev, V. L., & Moiseev, A. V. 2005, Astron. Lett., 31, 194 [NASA ADS] [CrossRef] [Google Scholar]
- Afanasiev, V. L., & Moiseev, A. V. 2011, Balt. Astron., 20, 363 [NASA ADS] [Google Scholar]
- Andreasyan, H. R., Magakian, T. Yu., Movsessian, T. A., & Moiseev, A. V. 2021, Astrophysics, 64, 187 [NASA ADS] [CrossRef] [Google Scholar]
- Anglada, G., Rodriguez, L. F., Canto, J., et al. 1992, ApJ, 395, 494 [NASA ADS] [CrossRef] [Google Scholar]
- Arce, H., & Goodman, A. A., 2002, ApJ, 575, 928 [NASA ADS] [CrossRef] [Google Scholar]
- Caratti o Garatti, A., Lopez, R. G., Weigelt, G., et al. 2013, A&A, 554, A66 [NASA ADS] [CrossRef] [EDP Sciences] [Google Scholar]
- Cohen, M. 1980, AJ, 85, 29 [Google Scholar]
- Cohen, M., Kuhi, L. V., & Harlan, E. A. 1977, ApJ, 215, L127 [NASA ADS] [CrossRef] [Google Scholar]
- Cohen, M., Kuhi, L. V., Harlan, E. A., et al. 1981, ApJ, 245, 920 [NASA ADS] [CrossRef] [Google Scholar]
- Giannini, T., Giunta, A., Gangi, M., et al. 2022, ApJ, 929, 129 [NASA ADS] [CrossRef] [Google Scholar]
- Gomez, M., Kenyon, S. J., & Whitney, B. A. 1997, AJ, 114, 265 [NASA ADS] [CrossRef] [Google Scholar]
- Gyulbudagyan, A. L., & Magakyan, T. Y. 1977, Sov, Astron. Lett., 3, 58 [Google Scholar]
- Gyulbudagyan, A. L., Magakian, T. Yu., & Amirkhanian, A. S. 1977, Sov. Astron. Lett., 3, 84 [Google Scholar]
- Hamidouche, M. 2010, ApJ, 722, 204 [NASA ADS] [CrossRef] [Google Scholar]
- Hartigan, P., Morse, J. A., Heathcote, S., & Cecil, G. 1993, ApJ, 414, L121 [NASA ADS] [CrossRef] [Google Scholar]
- Hartigan, P., Frank, A., Foster, J. M., et al. 2011, ApJ, 736, 29 [Google Scholar]
- Herbig, G. H. 1977, ApJ, 217, 693 [NASA ADS] [CrossRef] [Google Scholar]
- Herbig, G. H. 1989, Eur. South. Observ. Conf. Workshop Proc., 33, 233 [NASA ADS] [Google Scholar]
- Kun M., Kiss, Z. T., & Balog, Z. 2008, in Handbook of Star Forming Regions, ed. B. O. Reipurth (USA: ASP Books) [Google Scholar]
- Kun, M., Szegedi-Elek, E., Moór, A., et al. 2011, MNRAS, 413, 2689 [NASA ADS] [CrossRef] [Google Scholar]
- Magakian, T. Yu., & Movsessian, T. A. 2001, Astrophysics, 44, 419 [NASA ADS] [CrossRef] [Google Scholar]
- Massi, F., Caratti o Garatti, A., Cesaroni, R., et al. 2023, A&A, 672, A113 [NASA ADS] [CrossRef] [EDP Sciences] [Google Scholar]
- Levreault, R. M. 1984, ApJ, 277, 634 [NASA ADS] [CrossRef] [Google Scholar]
- Levreault, R. M., & Opal, C. B. 1987, AJ, 93, 669 [NASA ADS] [CrossRef] [Google Scholar]
- López, R., Estalella, R., Beltrán, M. T., et al. 2022, A&A, 661, A106 [NASA ADS] [CrossRef] [EDP Sciences] [Google Scholar]
- Moiseev, A. V. 2002, Bull. Spec. Astrophys. Obs., 54, 74 [NASA ADS] [Google Scholar]
- Moiseev, A. V. 2021, Astrophys. Bull., 76, 316 [NASA ADS] [CrossRef] [Google Scholar]
- Moiseev, A. V., & Egorov, O. V. 2008, Bull. Spec. Astrophys. Obs., 63, 181 [Google Scholar]
- Movsessian, T. A., Magakian, T. Yu., Bally, J., et al. 2007, A&A, 470, 605 [NASA ADS] [CrossRef] [EDP Sciences] [Google Scholar]
- Movsessian, T. A., Magakian, T. Y., & Moiseev, A. V. 2012, A&A, 541, A16 [NASA ADS] [CrossRef] [EDP Sciences] [Google Scholar]
- Neckel, T., Staude, H. J., Sarcander, M., et al. 1987, A&A, 175, 231 [NASA ADS] [Google Scholar]
- Ray, T. P. 1987, Irish Astron. J., 18, 21 [NASA ADS] [Google Scholar]
- Reipurth, B., Bally, J., & Devine, D. 1997, AJ, 114, 2708 [Google Scholar]
- Reipurth, B., Heathcote, S., Morse, J., et al. 2002, AJ, 123, 362 [NASA ADS] [CrossRef] [Google Scholar]
- Vioque, M., Oudmaijer, R. D., Baines, D., et al. 2018, A&A, 620, A128 [NASA ADS] [CrossRef] [EDP Sciences] [Google Scholar]
- Whelan, E. T., Dougados, C., Perrin, M. D., et al. 2010, ApJ, 720, L119 [Google Scholar]
The ADHOC software package was developed by J. Boulesteix (Marseilles Observatory) and is publicly available on the internet.
All Tables
Proper motions and heliocentric radial velocities of the knots in the PV Cep outflow.
All Figures
|
Fig. 1 Restored image of the PV Cep jet obtained from the 2003 observations with scanning FPI. Continuum-subtracted [S II] 6716 Å emission (gray scale) and the continuum image superposed (isolines). |
| In the text | |
|
Fig. 2 Restored image obtained from the 2020 observations with the scanning FPI of the PV Cep outflow in Hα emission (left panel), and the continuum-subtracted [S II] 6716 Å images restored from FPI observations in 2003 (central panel) and in 2020 (right panel). |
| In the text | |
|
Fig. 3 Two-dimensional map of the radial velocities in the PV Cep outflow system obtained from 2003 FPI observations (gray scale). The monochromatic image in Hα emission is superposed (isolines). |
| In the text | |
|
Fig. 4 Positions of the two pseudo-slits marked in the Hα image of the PV Cep outflow system (left panel) and the position-velocity diagrams for the Hα and [S II] 6716 Å lines, built from slit 1 (first two diagrams) and slit 2 (next two diagrams). |
| In the text | |
|
Fig. 5 High (gray scale) and low (isophotes) radial velocity structures in the Hα emission at knot D (left panel) and knot I (right panel). |
| In the text | |
|
Fig. 6 Proper motions of the knots of the HH 215 outflow, shown by vectors. The scale of the vectors is indicated by the arrow at the right side of the panel. |
| In the text | |
|
Fig. 7 Grayscale image of the HH 215 outflow in Hα, deprojected from Fig. 2a with a factor of 1/sini=2. |
| In the text | |
Current usage metrics show cumulative count of Article Views (full-text article views including HTML views, PDF and ePub downloads, according to the available data) and Abstracts Views on Vision4Press platform.
Data correspond to usage on the plateform after 2015. The current usage metrics is available 48-96 hours after online publication and is updated daily on week days.
Initial download of the metrics may take a while.