Open Access
Fig. 2
Download original image
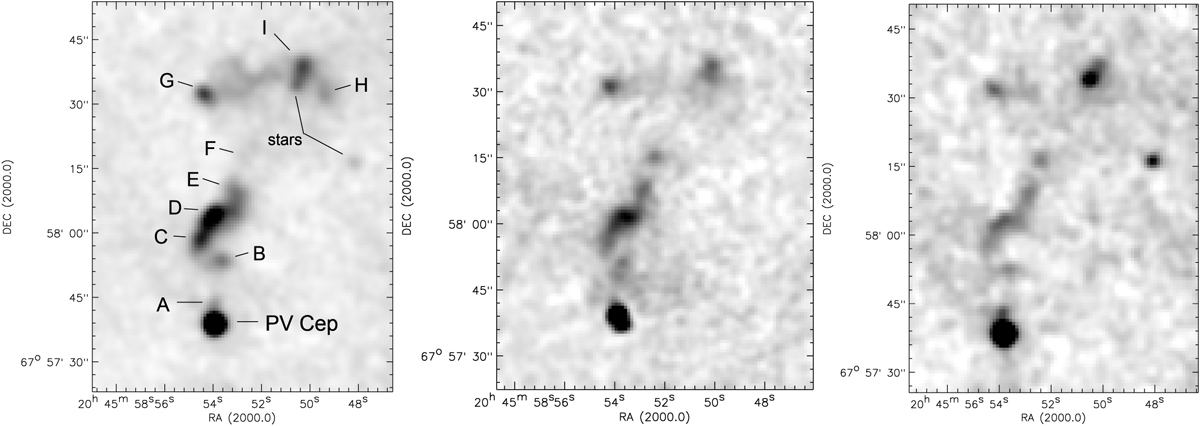
Restored image obtained from the 2020 observations with the scanning FPI of the PV Cep outflow in Hα emission (left panel), and the continuum-subtracted [S II] 6716 Å images restored from FPI observations in 2003 (central panel) and in 2020 (right panel).
Current usage metrics show cumulative count of Article Views (full-text article views including HTML views, PDF and ePub downloads, according to the available data) and Abstracts Views on Vision4Press platform.
Data correspond to usage on the plateform after 2015. The current usage metrics is available 48-96 hours after online publication and is updated daily on week days.
Initial download of the metrics may take a while.