Fig. B.1
Download original image
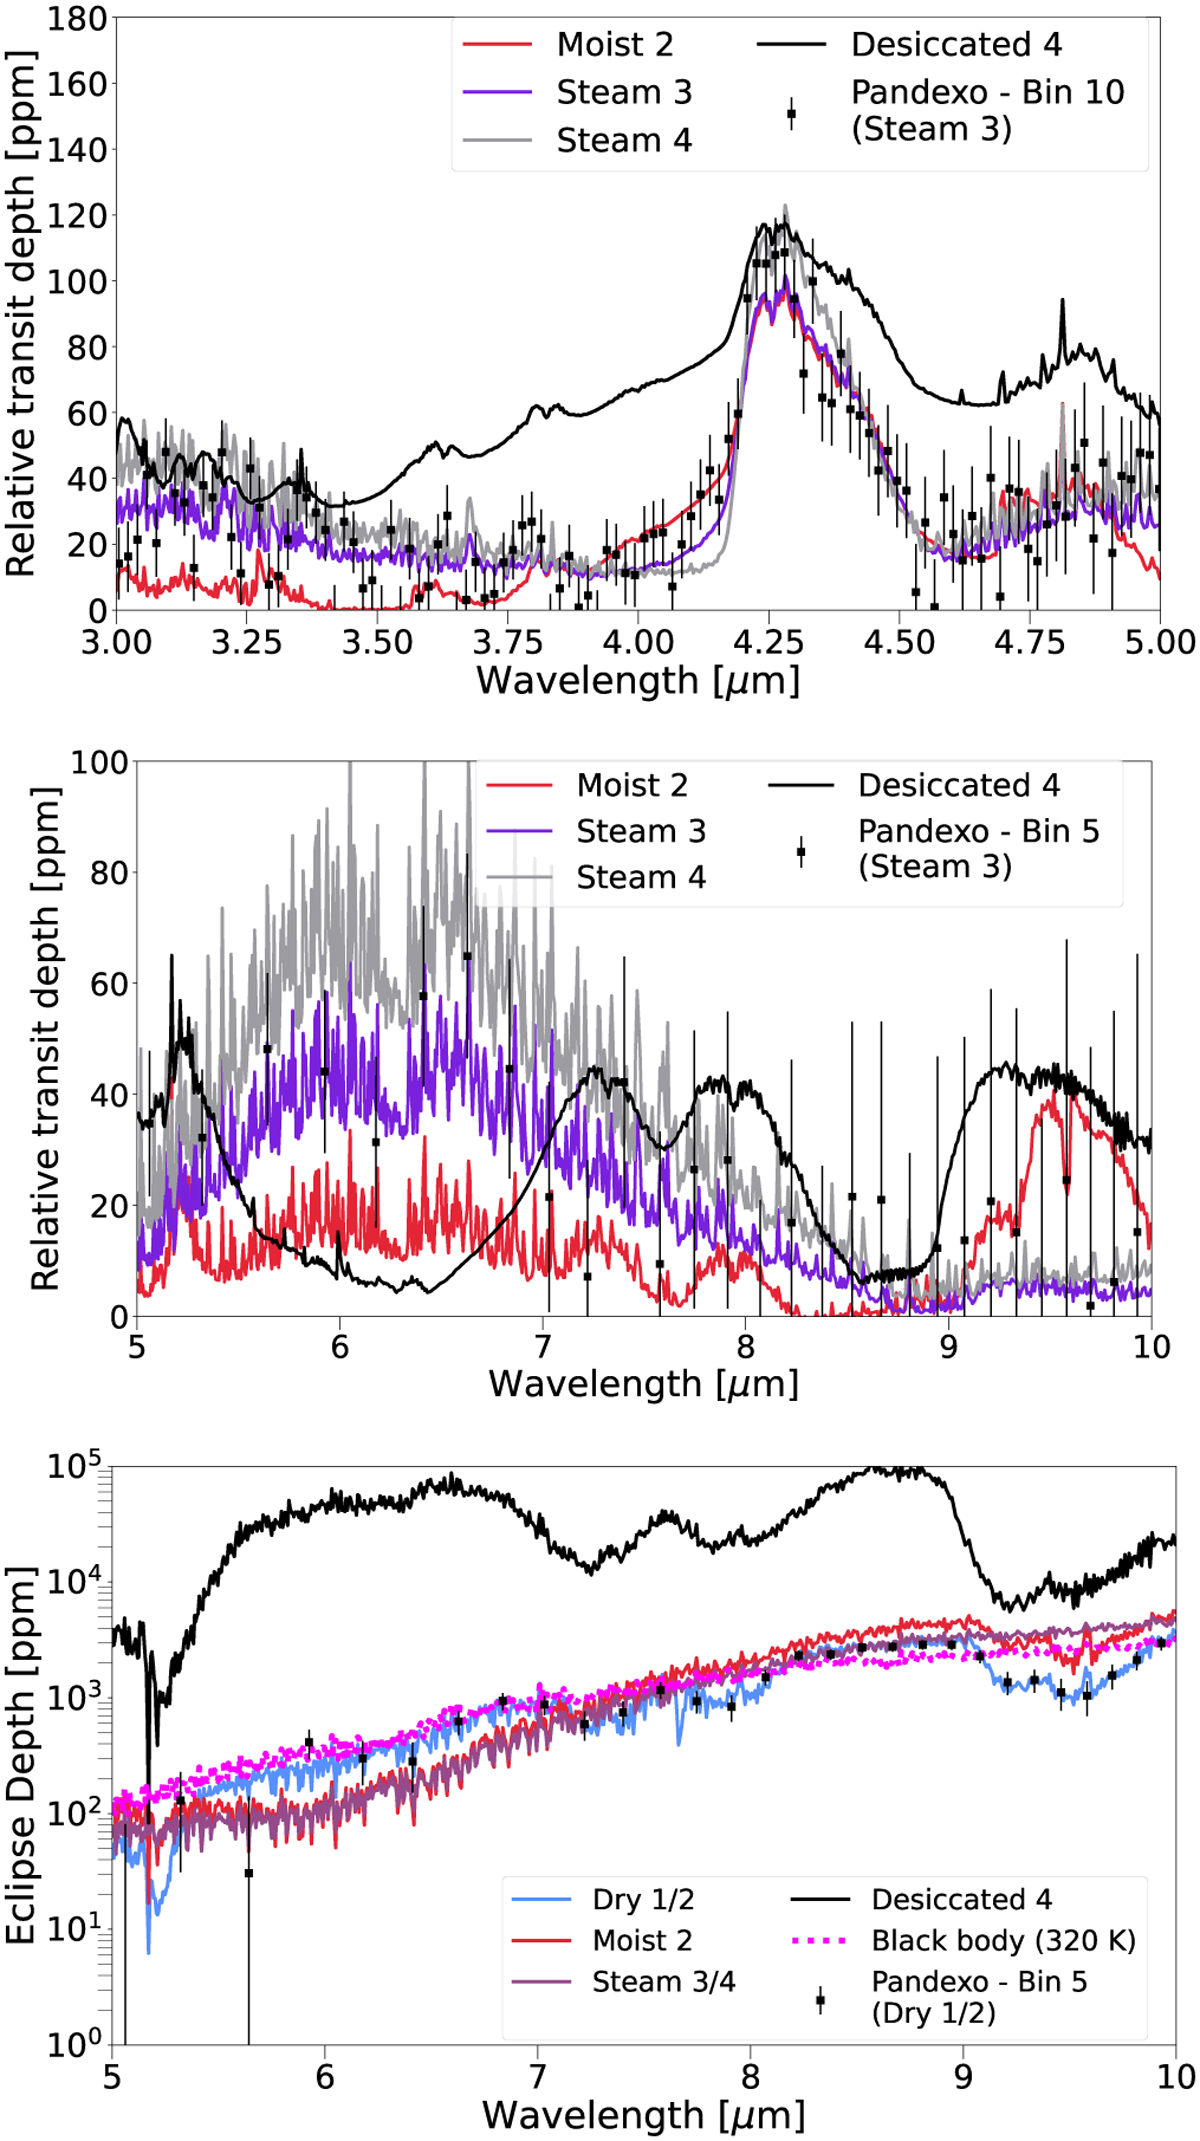
Transmission and eclipse data. The top and centre panels show transmission spectra for moist scenario 2 (red), steam scenarios 3 (purple) and 4 (grey), and the desiccated scenario 4 (black) for the JWST/NIRSpec wavelength range 3 – 5 µm (top) and the JWST/MIRI wavelength range between 5 – 10 µm (centre) with simulated noise (black error bars). We chose the G395M grism setting with 10 pixels per bin (top) and the MIRI LRS setting with 5 pixels per bin (centre). The bottom panel shows eclipse spectra for cloud-free atmospheres for the dry biotic scenarios 1/2 (blue), the moist biotic scenario 2 (red), the abiotic steam scenarios 3/4 (purple), and the desiccated scenario 4 (black) for the JWST/MIRI wavelength range 5 – 10 µm with simulated noise (black error bars), where we combined 5 pixels per bin.
Current usage metrics show cumulative count of Article Views (full-text article views including HTML views, PDF and ePub downloads, according to the available data) and Abstracts Views on Vision4Press platform.
Data correspond to usage on the plateform after 2015. The current usage metrics is available 48-96 hours after online publication and is updated daily on week days.
Initial download of the metrics may take a while.