Fig. 5
Download original image
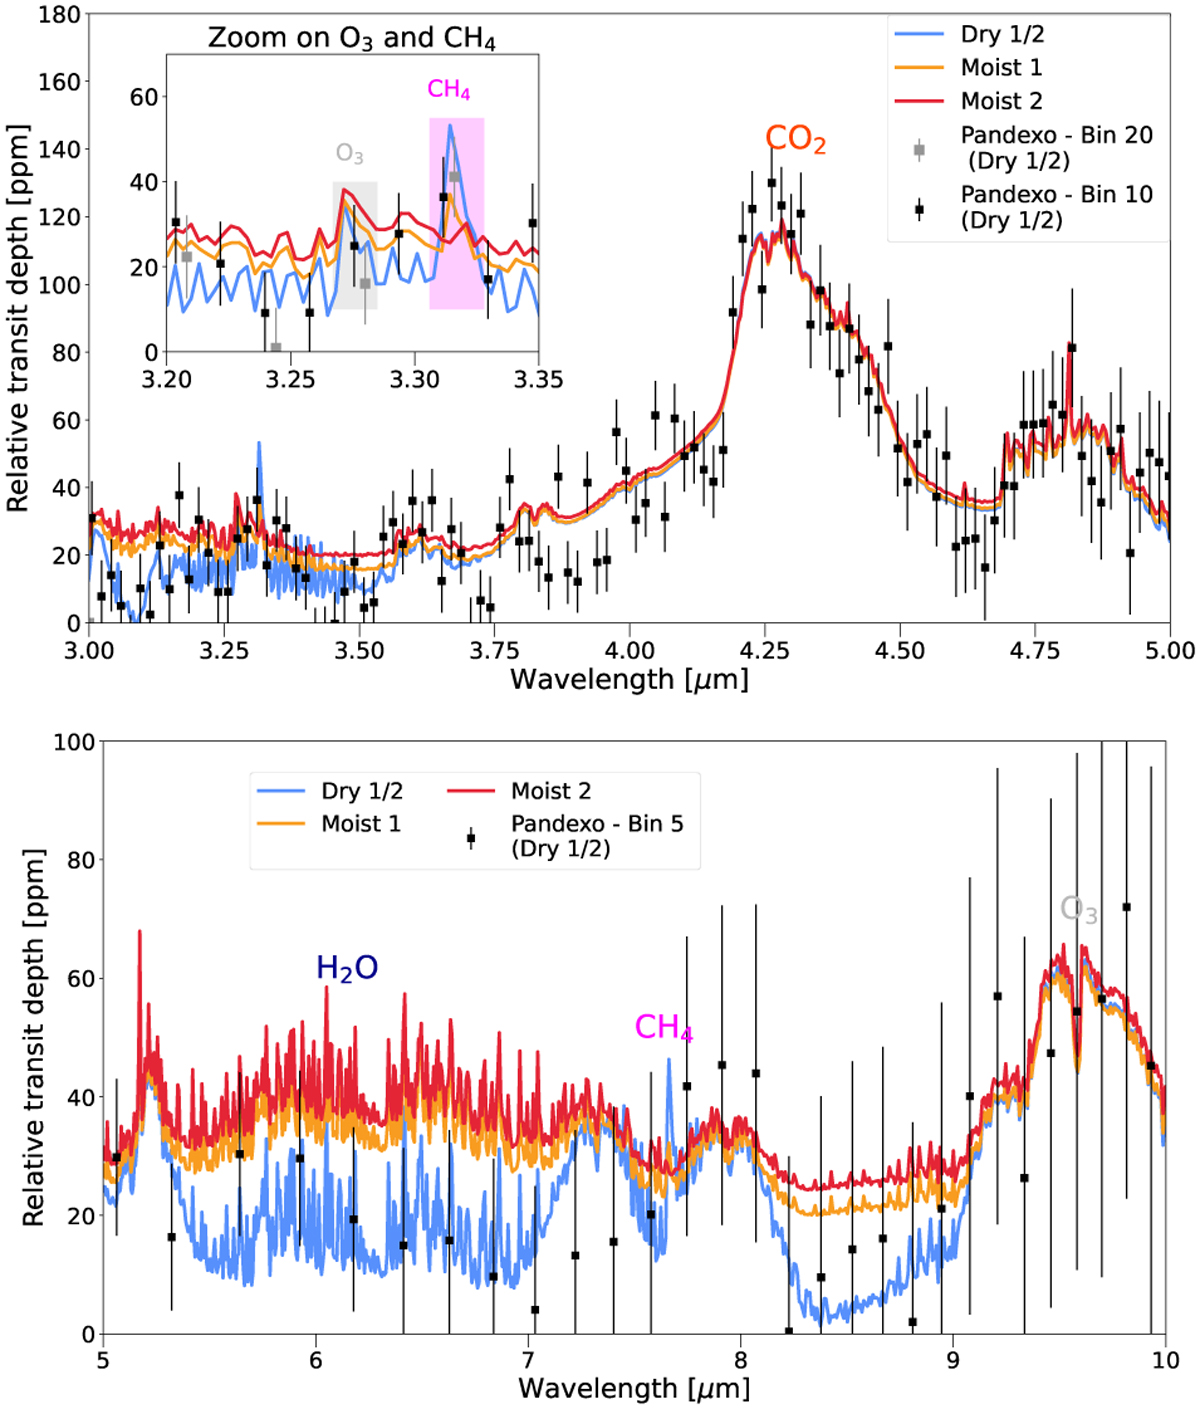
Transmission spectra for the dry and moist biotic scenarios 1 and 2. We show the JWST/NIRSpec range between 3 and 5 µm (top) with an inlay for the 3.2–3.35 µm range to highlight the O3 (grey box) and CH4 feature (magenta box). The bottom panel shows transmission spectra for 5–10 µm in the JWST/MIRI range (bottom). We note that the transmission spectra for the dry biotic scenarios 1 and 2 are identical. We further simulated JWST observations with PANDEXO for one scenario (dry 1/2) with 100 transit observations of TRAPPIST-1e (black error bars). We chose the G395M grism setting with 10 pixels per bin (top), 10 and 20 pixels per bins (inlay), and MIRI LRS setting with 5 pixels per bin (bottom panel).
Current usage metrics show cumulative count of Article Views (full-text article views including HTML views, PDF and ePub downloads, according to the available data) and Abstracts Views on Vision4Press platform.
Data correspond to usage on the plateform after 2015. The current usage metrics is available 48-96 hours after online publication and is updated daily on week days.
Initial download of the metrics may take a while.