Fig. B.1
Download original image
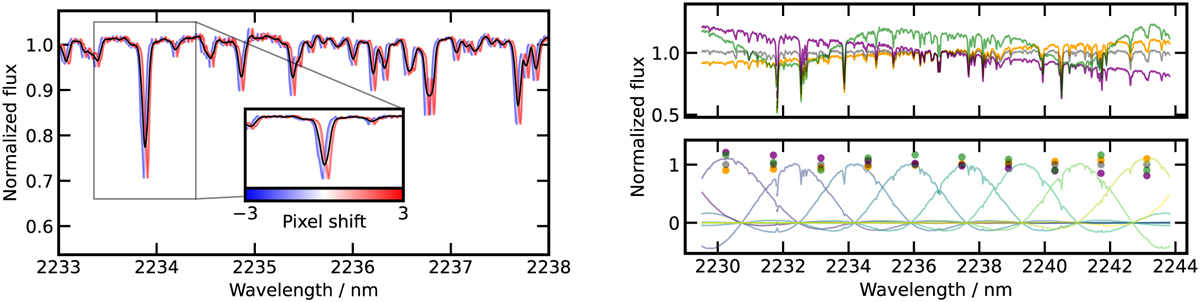
Components of the starlight model. Left panel: Broadening kernel. The black spectrum represents the combined spectrum with equally weighted components. Right panel: Spline decomposition of the starlight model. The upper part displays the resulting spectra corresponding to different amplitudes, and the lower part the individual spline components. The linear amplitudes used to generate the spectra in the upper part are indicated by markers in the lower part.
Current usage metrics show cumulative count of Article Views (full-text article views including HTML views, PDF and ePub downloads, according to the available data) and Abstracts Views on Vision4Press platform.
Data correspond to usage on the plateform after 2015. The current usage metrics is available 48-96 hours after online publication and is updated daily on week days.
Initial download of the metrics may take a while.