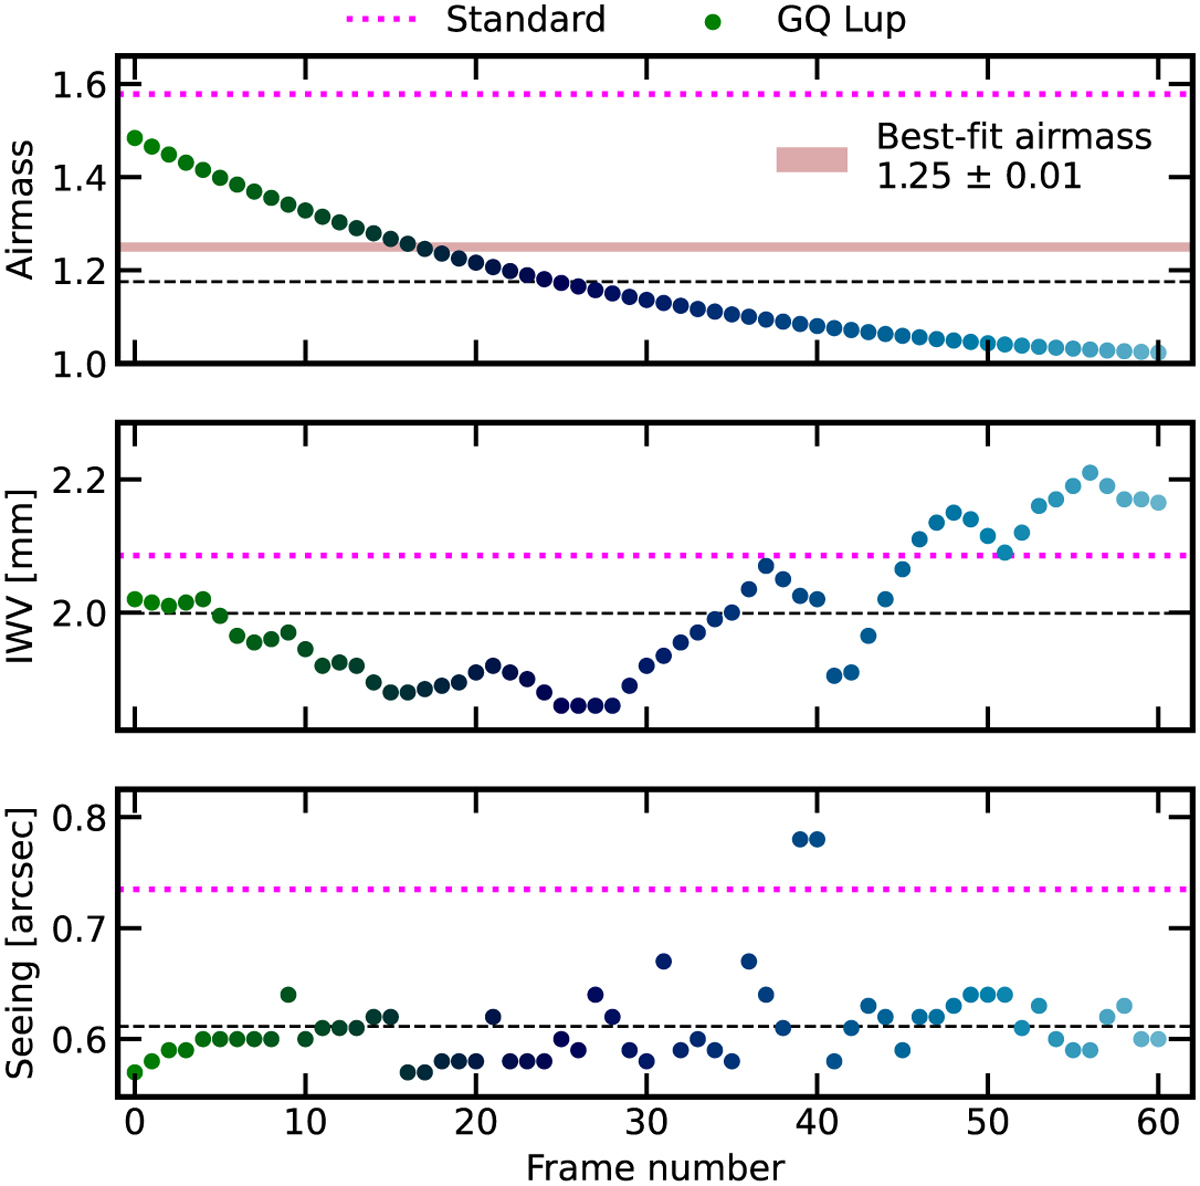
Fig. A.1
Download original image
Observing conditions over a 3-hour science exposure sequence. Airmass, integrated water vapour, and seeing are plotted in the top, middle, and bottom panels, respectively. Average values are indicated by dashed black lines. Pink data points represent standard star observations, taken immediately before the science sequence. The retrieved effective airmass, with 1σ uncertainty indicated by the line width, is overlaid in the airmass panel.
Current usage metrics show cumulative count of Article Views (full-text article views including HTML views, PDF and ePub downloads, according to the available data) and Abstracts Views on Vision4Press platform.
Data correspond to usage on the plateform after 2015. The current usage metrics is available 48-96 hours after online publication and is updated daily on week days.
Initial download of the metrics may take a while.