Fig. 6
Download original image
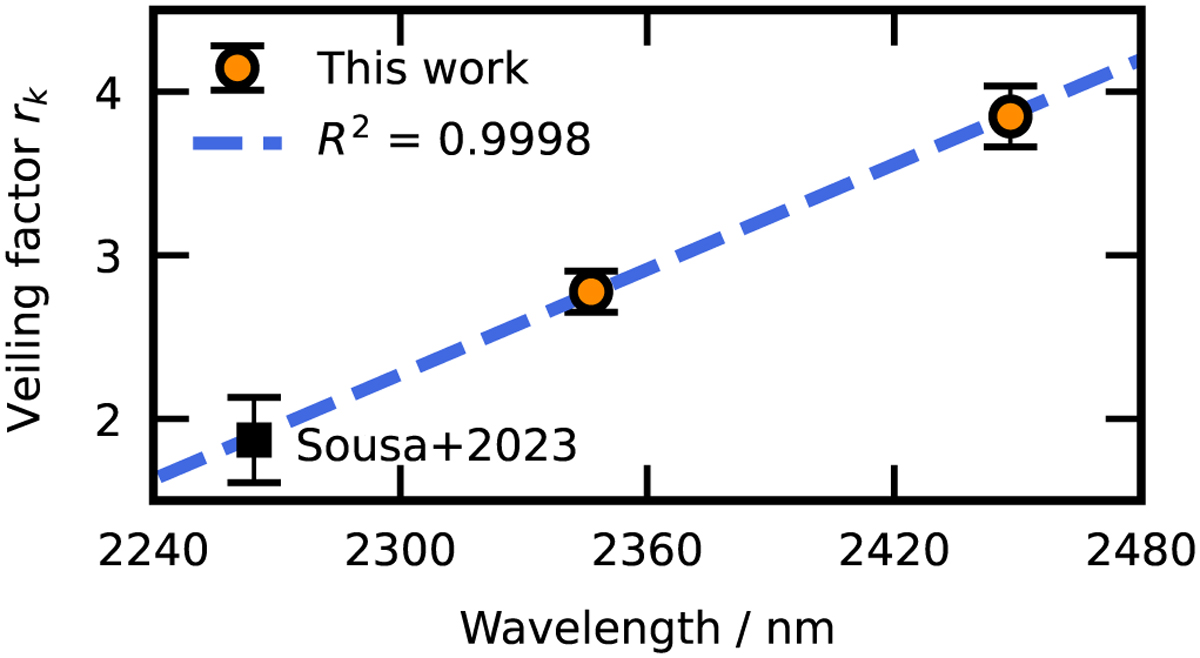
Veiling factor of GQ Lup A as a function of wavelength. The veiling factors for each spectral order derived from the fitted linear amplitudes are shown in orange, with error bars representing the standard deviation between the three detectors of each order. The measurement from Sousa et al. (2023) is included to fit the three points with a linear function of slope 0.011 nm−1.
Current usage metrics show cumulative count of Article Views (full-text article views including HTML views, PDF and ePub downloads, according to the available data) and Abstracts Views on Vision4Press platform.
Data correspond to usage on the plateform after 2015. The current usage metrics is available 48-96 hours after online publication and is updated daily on week days.
Initial download of the metrics may take a while.