Fig. 5
Download original image
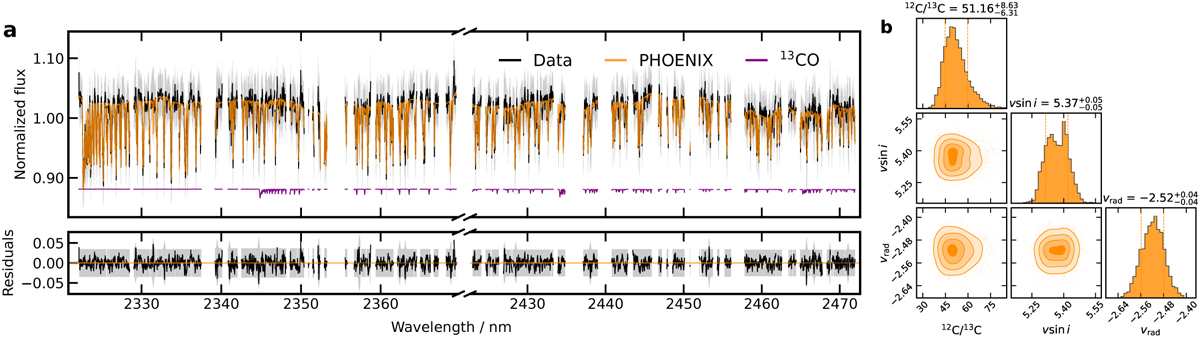
Best-fit model of GQ Lup A. a. Spectrum with the veiling continuum subtracted and divided by the telluric model. The observed spectrum is shown in black, the PHOENIX model with optimal linear amplitudes in orange and the 13CO lines from the best-fit model in purple. The residuals of the are shown in the bottom panel, the shaded grey region indicates the root-squared diagonal of the covariance matrix with the GP kernel. b. Posterior distributions of the carbon isotope ratio, projected rotational velocity and radial velocity of GQ Lup A.
Current usage metrics show cumulative count of Article Views (full-text article views including HTML views, PDF and ePub downloads, according to the available data) and Abstracts Views on Vision4Press platform.
Data correspond to usage on the plateform after 2015. The current usage metrics is available 48-96 hours after online publication and is updated daily on week days.
Initial download of the metrics may take a while.