Fig. 4
Download original image
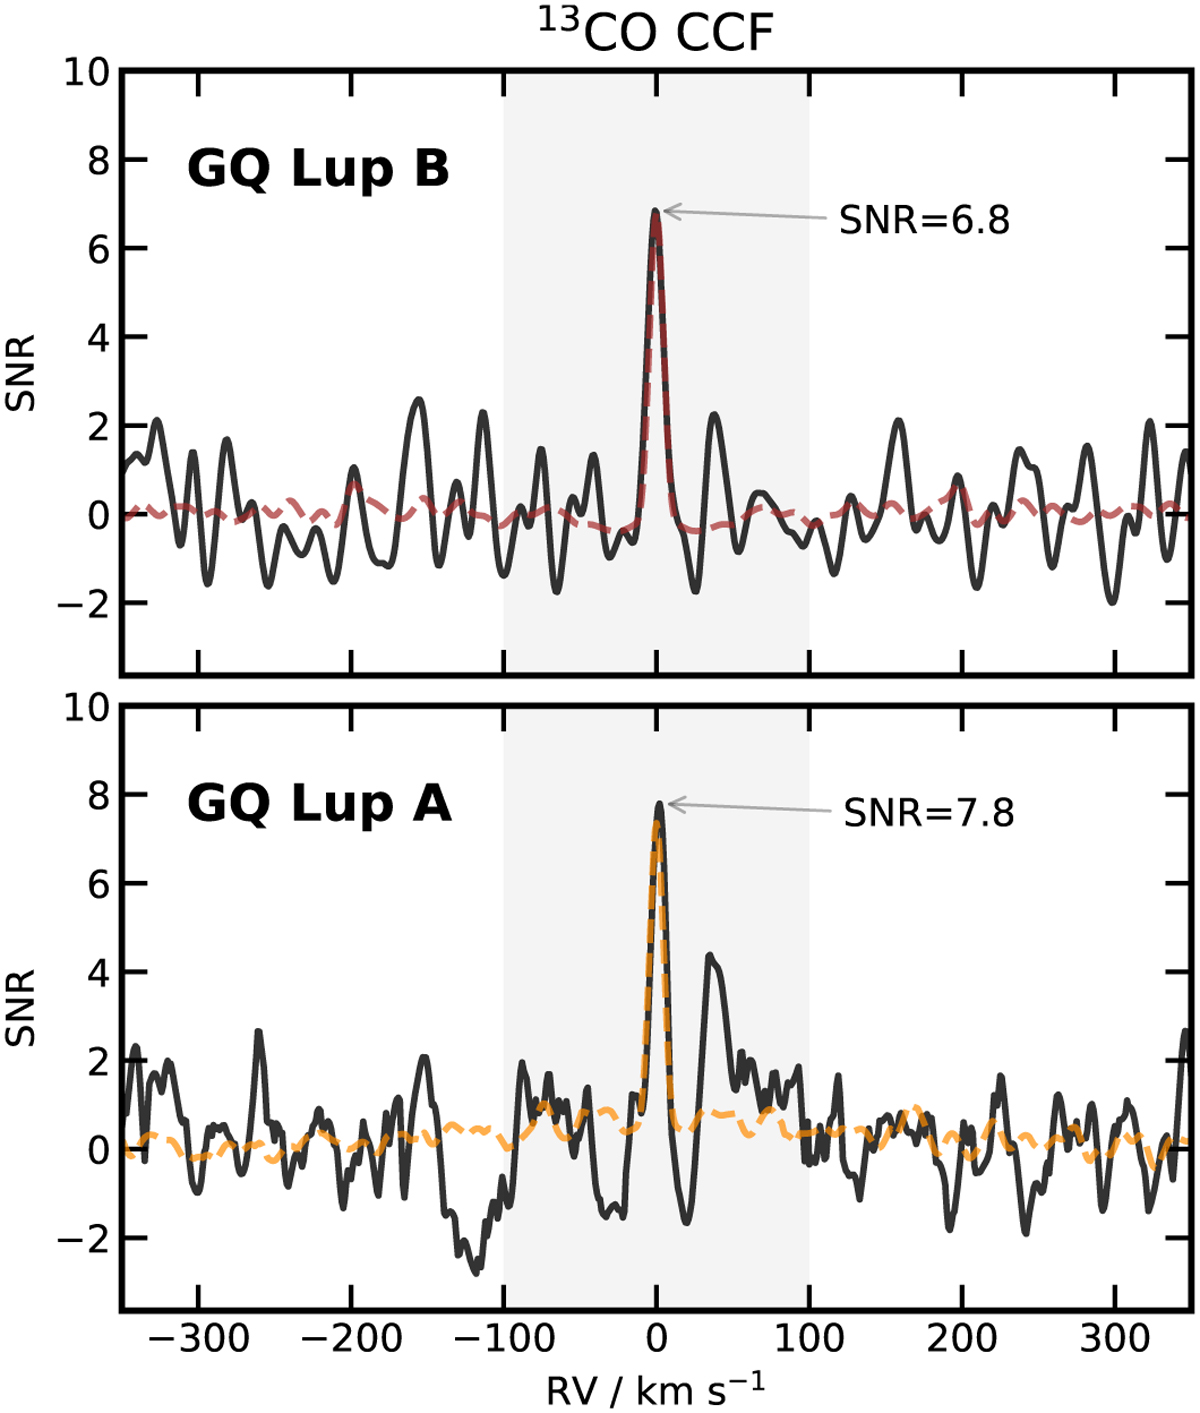
Cross-correlation functions (CCFs) of the data and the best- fit models of 13CO for GQ Lup B (top) and GQ Lup A (bottom). The CCFs are shown in black, with the auto-correlation functions of the templates shown in brown and orange. The CCFs are calculated between the data residuals and the model residuals following the methodology from Zhang et al. (2021a) (also in de Regt et al. 2024).
Current usage metrics show cumulative count of Article Views (full-text article views including HTML views, PDF and ePub downloads, according to the available data) and Abstracts Views on Vision4Press platform.
Data correspond to usage on the plateform after 2015. The current usage metrics is available 48-96 hours after online publication and is updated daily on week days.
Initial download of the metrics may take a while.