Fig. 2
Download original image
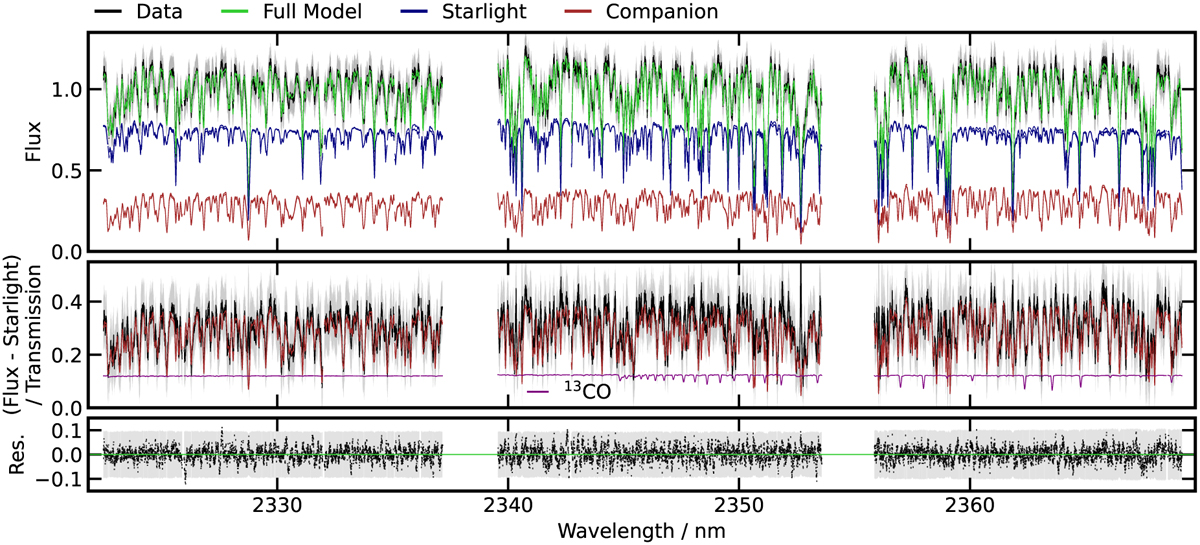
Best-fit model of the spectrum at the position of GQ Lup B. Top: observed spectrum (black), joint best-fit model (green) and components of the starlight model and companion (blue and brown, respectively). Centre: data with the best-fit starlight model subtracted compared to the companion model. Bottom: residuals of the best-fit model. The shaded region represents the root-squared diagonal of the covariance matrix with the optimal noise scaling factor.
Current usage metrics show cumulative count of Article Views (full-text article views including HTML views, PDF and ePub downloads, according to the available data) and Abstracts Views on Vision4Press platform.
Data correspond to usage on the plateform after 2015. The current usage metrics is available 48-96 hours after online publication and is updated daily on week days.
Initial download of the metrics may take a while.