Fig. E.1
Download original image
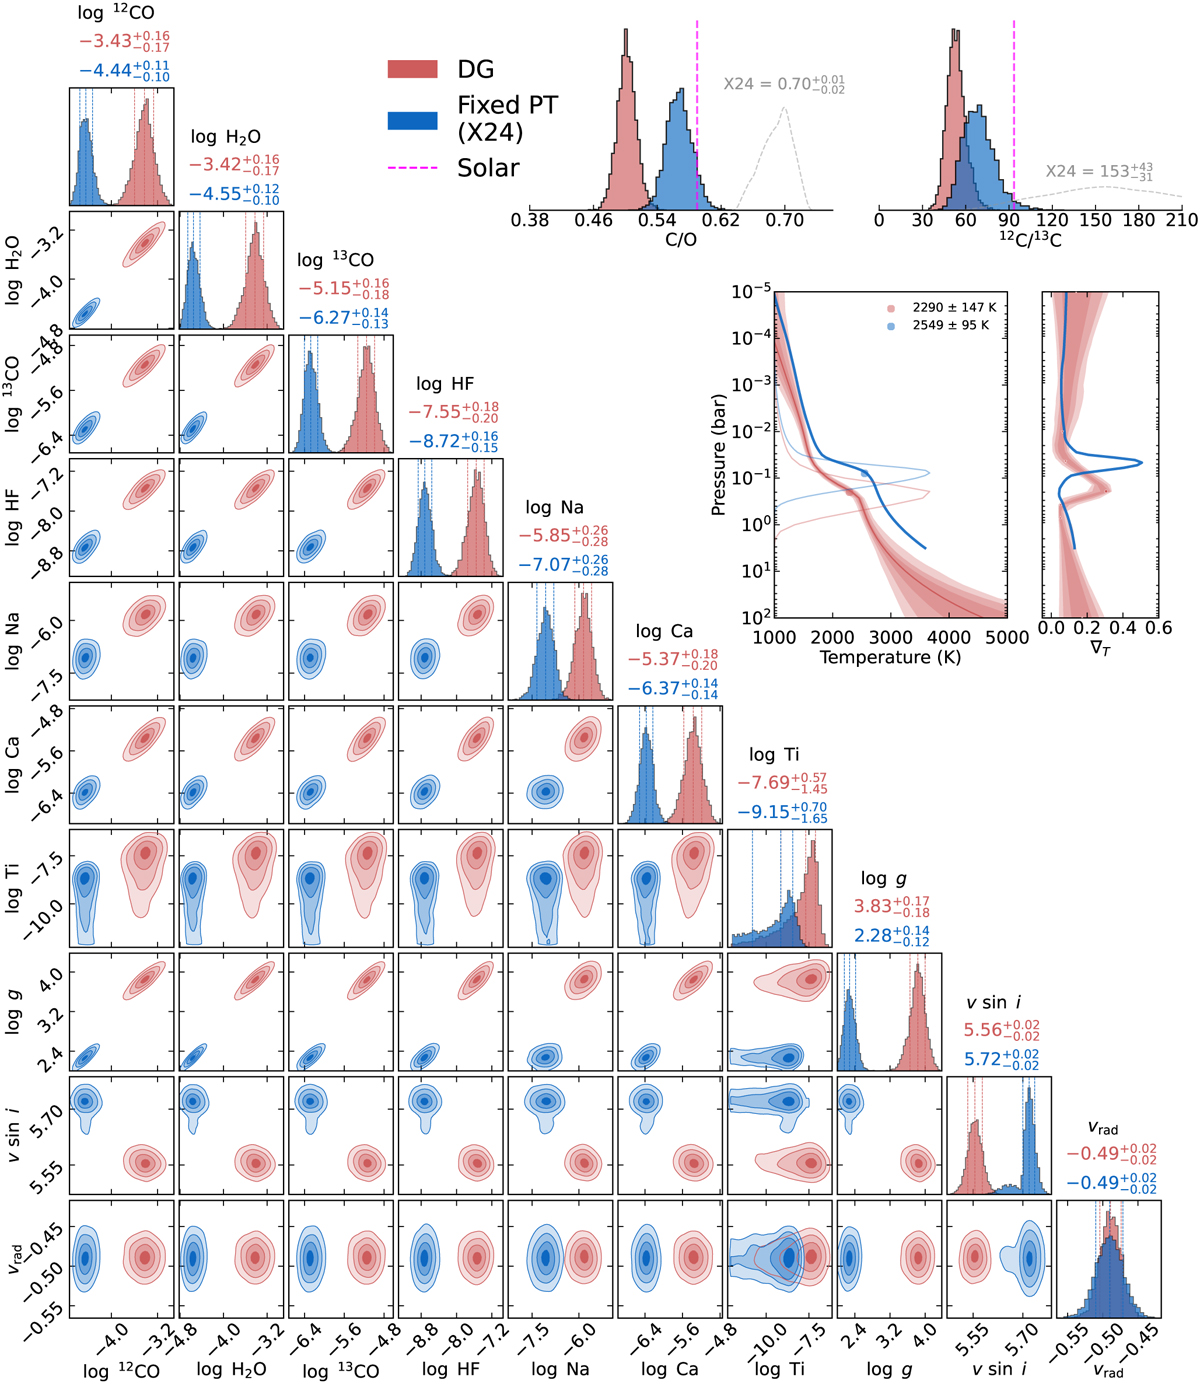
Comparison of posterior distributions for selected best-fit parameters of GQ Lup B, highlighting differences between our fiducial model (with DG) and the fixed PT profile model from Xuan et al. 2024a (X24). Dashed lines in the corner plot represent the 16th and 84th percentiles of the distributions. Derived C/O and 12C/13C values are displayed in the top-right corner, with the dashed grey probability density indicating the values reported by X24. The middle-right panel shows the retrieved temperature profiles, while the rightmost panel presents the corresponding temperature gradients.
Current usage metrics show cumulative count of Article Views (full-text article views including HTML views, PDF and ePub downloads, according to the available data) and Abstracts Views on Vision4Press platform.
Data correspond to usage on the plateform after 2015. The current usage metrics is available 48-96 hours after online publication and is updated daily on week days.
Initial download of the metrics may take a while.