Fig. D.1
Download original image
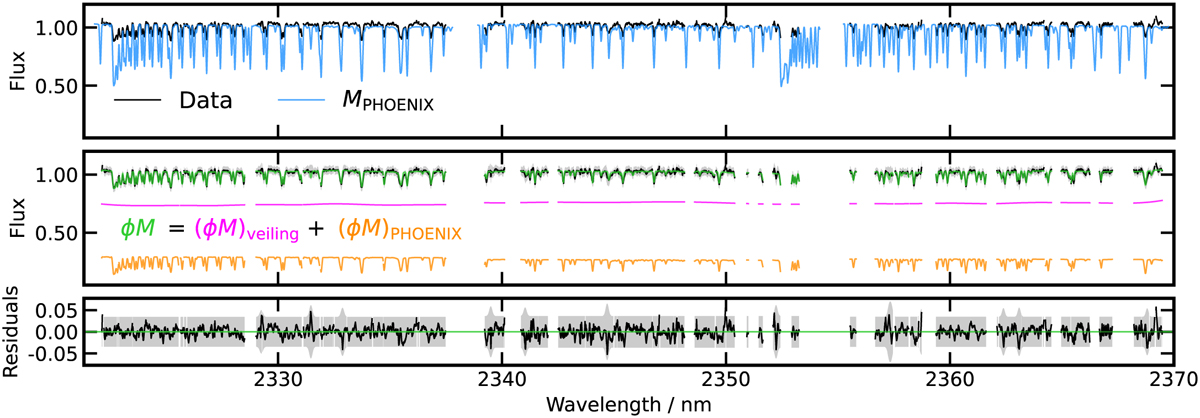
Observed spectrum of GQ Lup A (black) for the spectral order centred at 2345 nm, compared with a PHOENIX template (Teff = 4300 K, log g = 4.0) that includes instrumental and rotational broadening. The mismatch between the observed line depths and the model without veiling is evident. The second panel shows the best-fit linear model (green), which incorporates a veiling continuum (pink) alongside the PHOENIX model (orange). Residuals of the best-fit model are presented in the third panel.
Current usage metrics show cumulative count of Article Views (full-text article views including HTML views, PDF and ePub downloads, according to the available data) and Abstracts Views on Vision4Press platform.
Data correspond to usage on the plateform after 2015. The current usage metrics is available 48-96 hours after online publication and is updated daily on week days.
Initial download of the metrics may take a while.