Fig. 1
Download original image
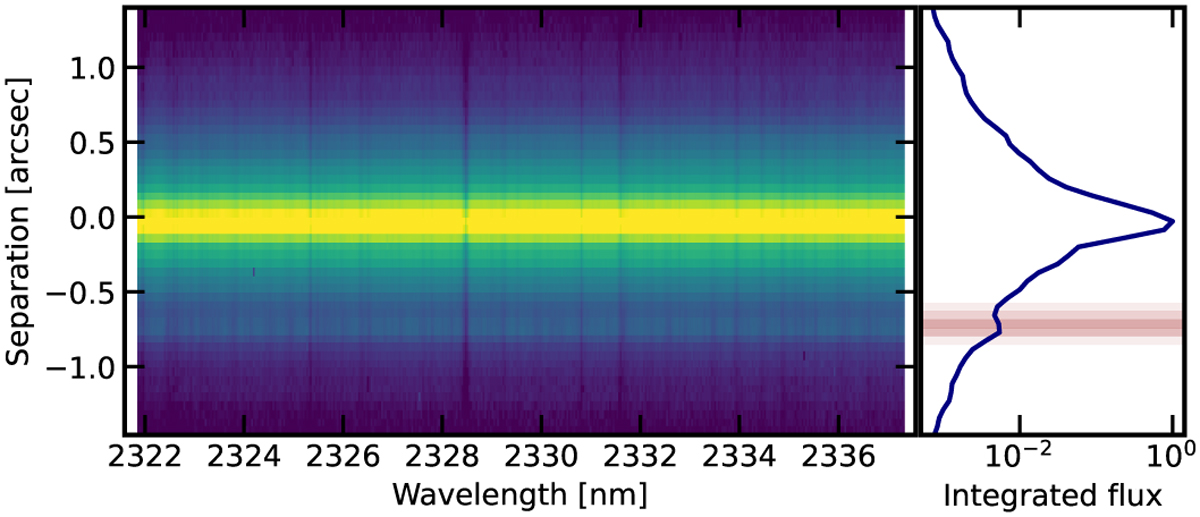
Calibrated 2D image of a single order-detector pair. The vertical axis is the spatial direction and the horizontal axis the spectral direction. The bright central source is GQ Lup A, and the fainter source at −0.71 arcseconds is GQ Lup B. The telluric lines are visible as vertical stripes in the image. The right panel shows the integrated line spread function and the spatial profile employed for the extraction of the data at the position of GQ Lup B.
Current usage metrics show cumulative count of Article Views (full-text article views including HTML views, PDF and ePub downloads, according to the available data) and Abstracts Views on Vision4Press platform.
Data correspond to usage on the plateform after 2015. The current usage metrics is available 48-96 hours after online publication and is updated daily on week days.
Initial download of the metrics may take a while.