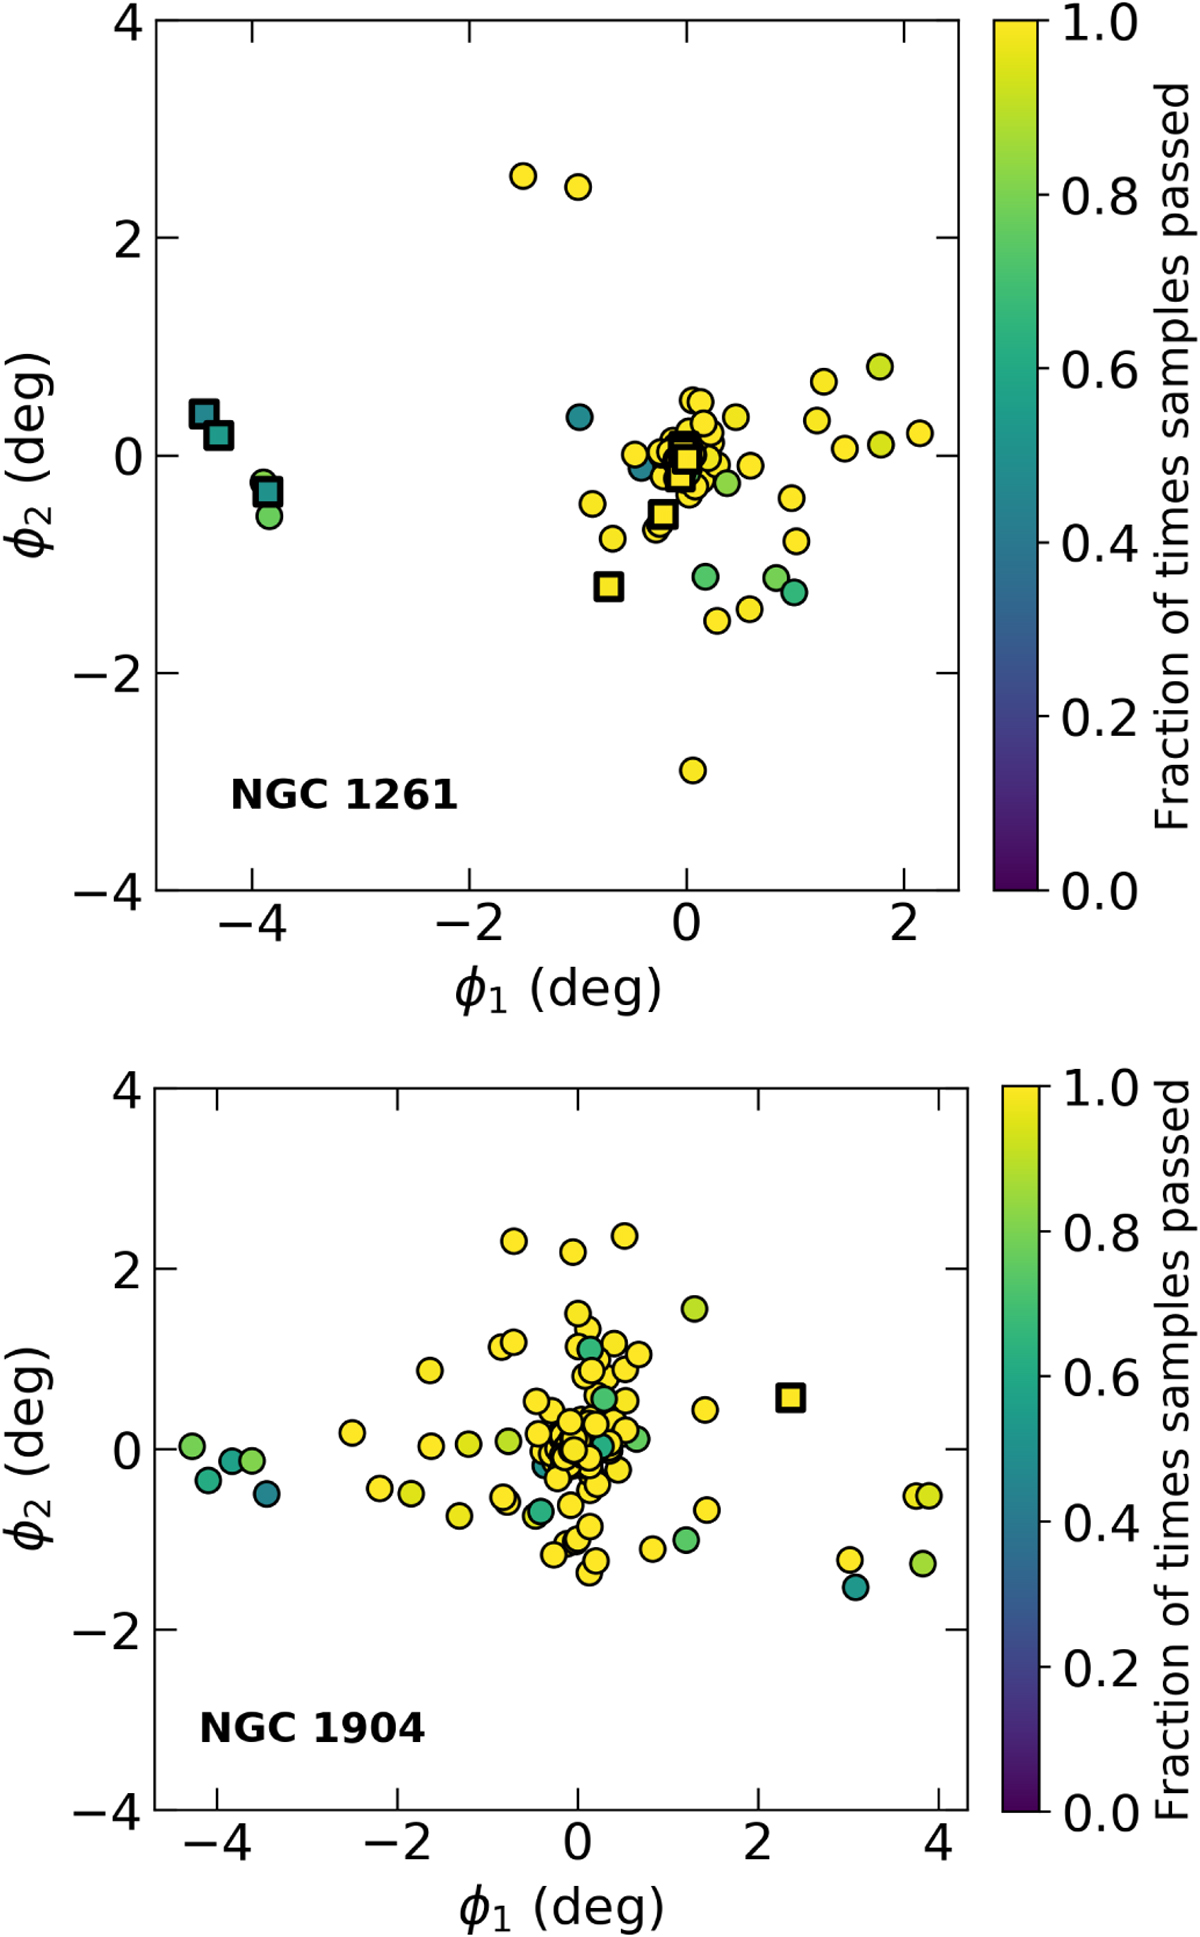
Fig. 9
Download original image
An assessment of the contamination within the samples of possible members. This is calculated by sampling 100 values from the posterior distributions of our mixture model parameters and checking how many times each star survives our cut using the model parameters from each of the 100 samples. The potential members (in yellow) survived 100% of the time, while those closer to blue survived the corresponding fraction of times. Contaminants identified through their position in the CMD are indicated using the square markers.
Current usage metrics show cumulative count of Article Views (full-text article views including HTML views, PDF and ePub downloads, according to the available data) and Abstracts Views on Vision4Press platform.
Data correspond to usage on the plateform after 2015. The current usage metrics is available 48-96 hours after online publication and is updated daily on week days.
Initial download of the metrics may take a while.