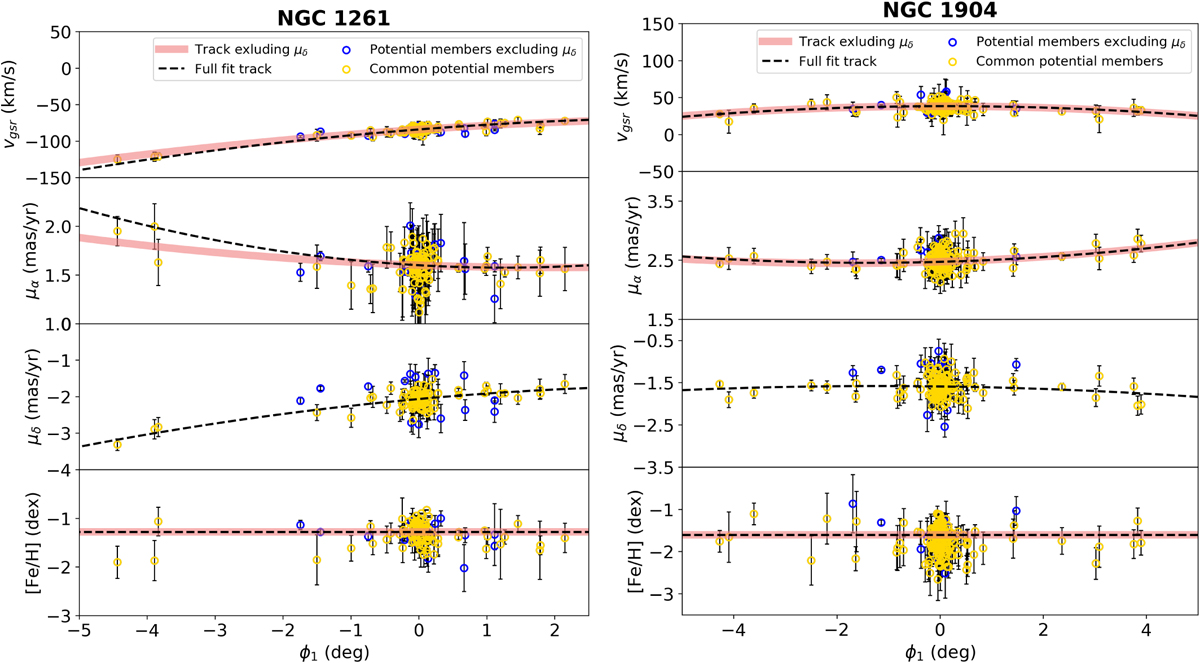
Fig. 8
Download original image
Comparison between the full-fit runs described in Sect. 3, and the new runs where µδ is not taken into account. The best-fit tracks from the full-fit runs, first shown in Figs. 6 and 7, are re-plotted here using the dashed line. The best-fit tracks from the new runs are shown using the solid red line. A new lower limit is enforced on the membership probability from the new runs and the remaining stars are cross-matched with the potential members from the full-fit results of Sect. 4. The common members between the two runs are shown in yellow and those that are not common are shown in dark blue. In this plot we see that the distribution of stars in µδ follows the same track as the original runs, even though it was not taken into account.
Current usage metrics show cumulative count of Article Views (full-text article views including HTML views, PDF and ePub downloads, according to the available data) and Abstracts Views on Vision4Press platform.
Data correspond to usage on the plateform after 2015. The current usage metrics is available 48-96 hours after online publication and is updated daily on week days.
Initial download of the metrics may take a while.