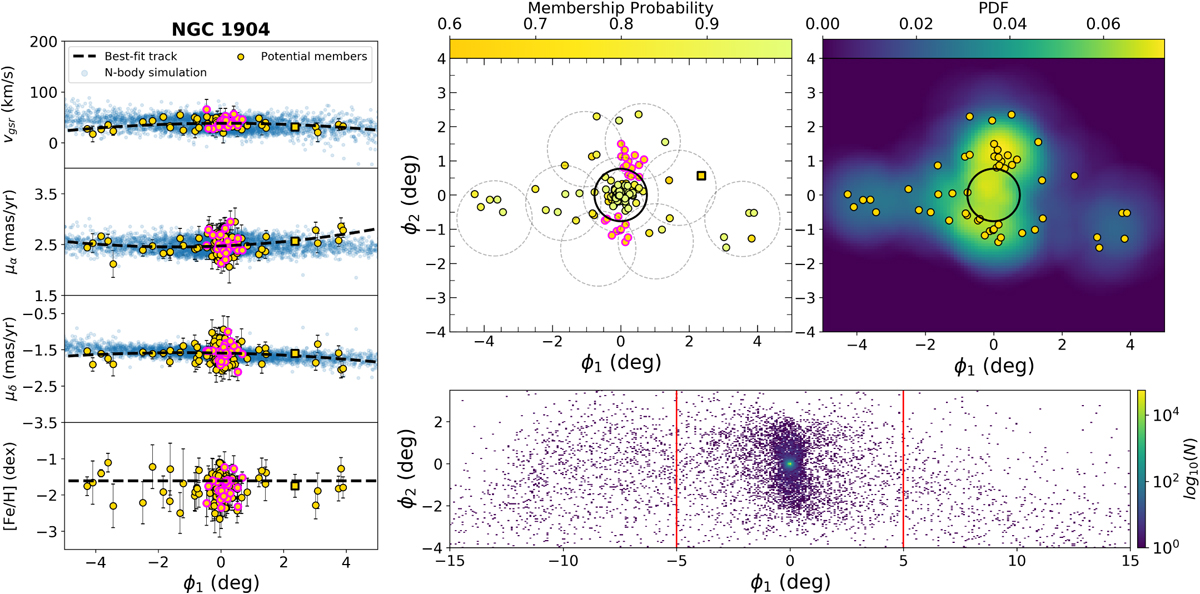
Fig. 7
Download original image
Same as Fig. 6, but for NGC 1904. In the top middle panel we show the stars that form overdensities above and below the cluster in ϕ2 (in magenta). They are also highlighted in the left panel, showing that they have similar properties to the other likely cluster and stream stars. These overdensities are clearly visible in the density plot provided in the top right panel. The 2D histogram of the N-body simulation shown in bottom right panel also shows a clear distinction between the inner tails, which correspond to our detected overdensities, and the outer tails.
Current usage metrics show cumulative count of Article Views (full-text article views including HTML views, PDF and ePub downloads, according to the available data) and Abstracts Views on Vision4Press platform.
Data correspond to usage on the plateform after 2015. The current usage metrics is available 48-96 hours after online publication and is updated daily on week days.
Initial download of the metrics may take a while.