Fig. 6
Download original image
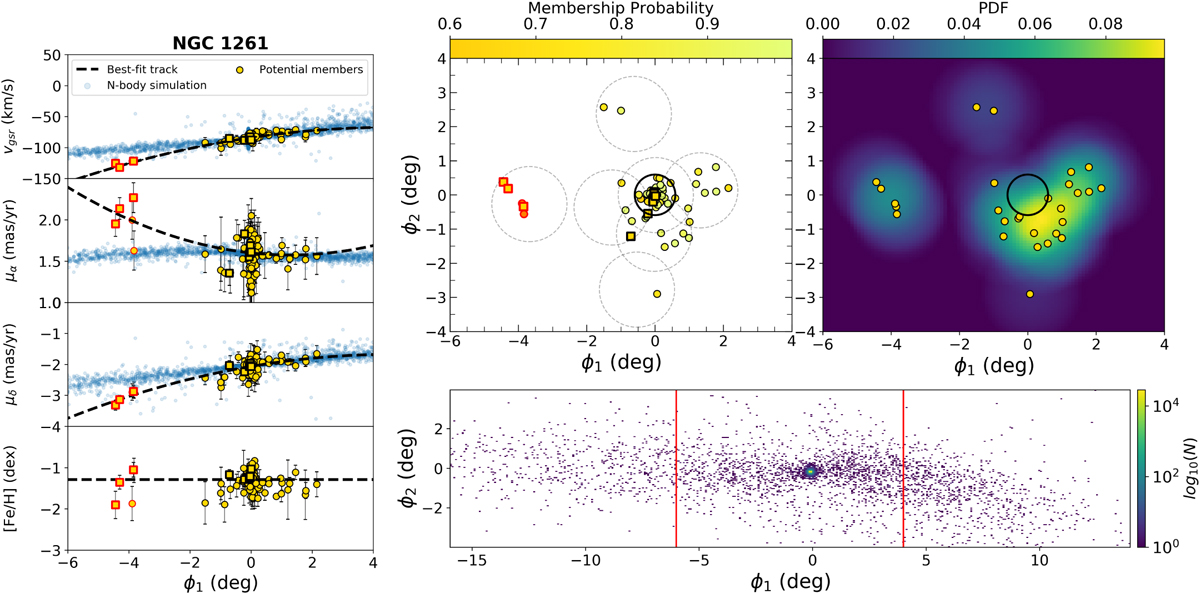
Main results for NGC 1261. Left: distribution of the modelled properties of the stars belonging to NGC 1261 and its stream as a function of ϕ1 after enforcing a 60% lower limit on the membership probability. The error bars represent the measurement uncertainties. The black dashed line represents the best-fit track used to model the mean value for the respective property at a given ϕ1. The results from the N-body simulation in each of the four dimensions are in blue. Stars with v𝑔sr values inconsistent with the N-body simulation are outlined in red. Top middle: spatial distribution of the same stars plotted in the left panel. The dashed circles show the outlines of the fields targeted by S5. The solid circle shows the extent of rJ. Stars plotted using the square markers are those that show different CMD properties from the cluster, as shown in Fig. 4. Top right: 2D density plot of the distribution of potential member stars around NGC 1261. Stars within rJ were removed when creating this plot to enhance the density contrast. Bottom right: 2D histogram showing the density of simulation particles on the sky. The vertical red lines indicate the same window on the sky as shown in the top panels.
Current usage metrics show cumulative count of Article Views (full-text article views including HTML views, PDF and ePub downloads, according to the available data) and Abstracts Views on Vision4Press platform.
Data correspond to usage on the plateform after 2015. The current usage metrics is available 48-96 hours after online publication and is updated daily on week days.
Initial download of the metrics may take a while.