Fig. 4
Download original image
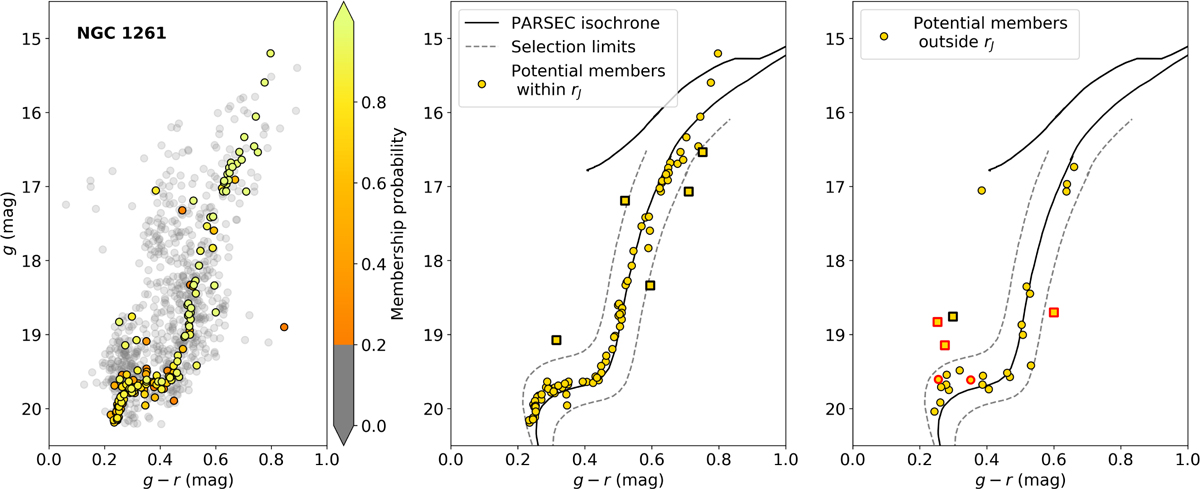
Dereddened colour-magnitude diagram for likely NGC 1261 cluster and stream members using the g and r bands from the available DECam photometric measurements. Left panel: all stars in our sample for this cluster are colour-coded according to the calculated membership probability; grey indicates stars with probabilities of less than 20%. We observe a very narrow distribution that emerges within the whole sample. Middle panel: high-probability member stars are extracted using the threshold of 60% and considering only stars within a radius r = rJ around the cluster. An isochrone is also added for comparison. The dashed lines separate stars with CMD properties similar to those of the cluster from likely contaminants (square markers). Right panel: similarly, we plot high-probability stars that lie outside of r = rJ. The stars outlined in red are the same stars selected in Fig. 6 as having different vgsr from the N-body simulation prediction.
Current usage metrics show cumulative count of Article Views (full-text article views including HTML views, PDF and ePub downloads, according to the available data) and Abstracts Views on Vision4Press platform.
Data correspond to usage on the plateform after 2015. The current usage metrics is available 48-96 hours after online publication and is updated daily on week days.
Initial download of the metrics may take a while.