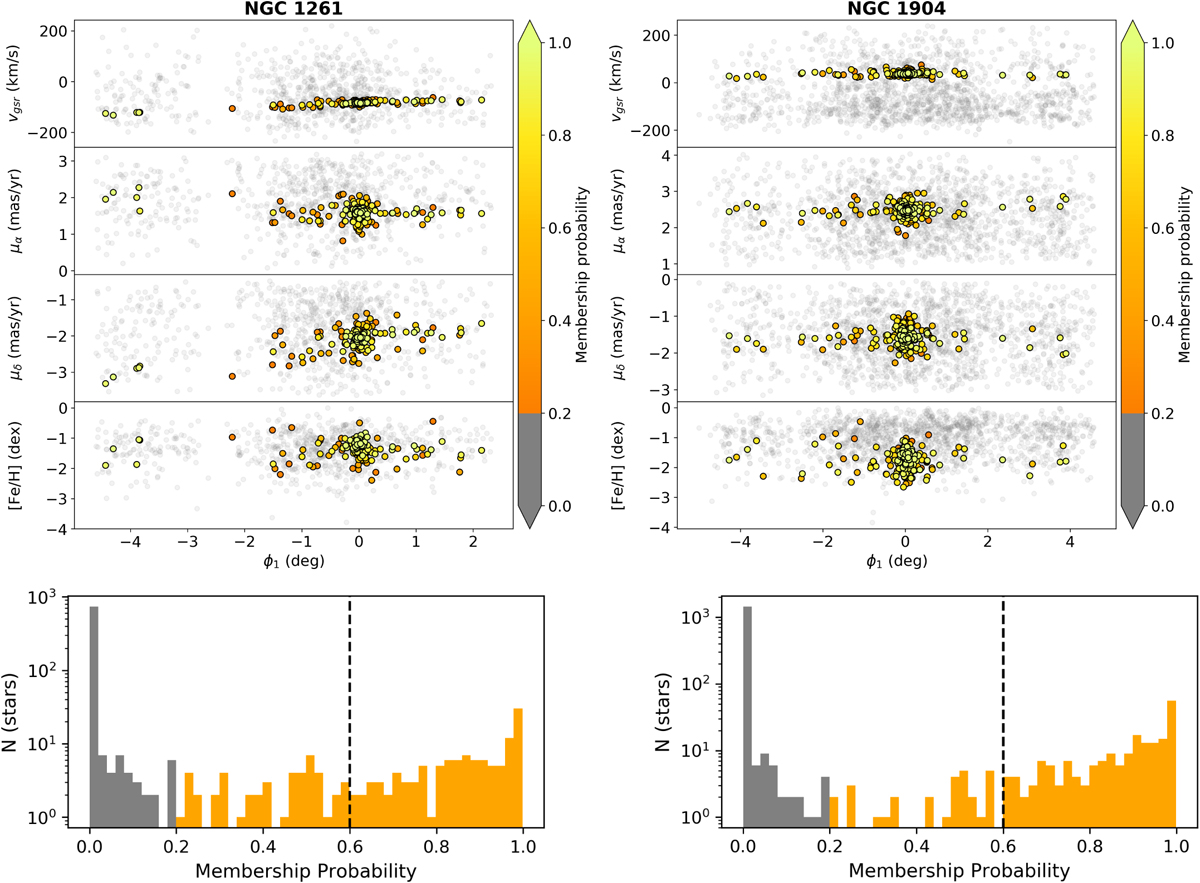
Fig. 3
Download original image
Modelled properties of stars within the sample (left for NGC 1261 and right for NGC 1904) as a function of ϕ1. As in Fig. 2, each point is colour-coded according to its membership probability of belonging to the respective cluster. The bottom two panels show the histograms of all probabilities in the sample. The vertical lines at 0.6 (60%) represent the threshold on the probability.
Current usage metrics show cumulative count of Article Views (full-text article views including HTML views, PDF and ePub downloads, according to the available data) and Abstracts Views on Vision4Press platform.
Data correspond to usage on the plateform after 2015. The current usage metrics is available 48-96 hours after online publication and is updated daily on week days.
Initial download of the metrics may take a while.