Fig. 11
Download original image
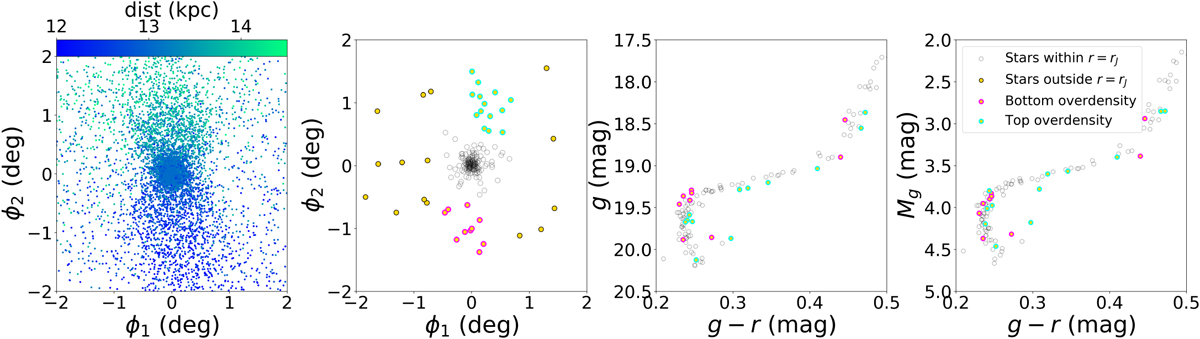
Confirmation of the distant gradient along ϕ2 for NGC 1904. Left: distance gradient along ϕ2 seen in the simulations of NGC 1904. Middle left: Top and bottom overdensities of stars (in cyan and magenta, respectively). Potential GC members that fall within rJ are shown as empty black circles, while those outside rJ are shown in yellow. Middle right: distance gradient can be seen in the main sequence and subgiant branches given the observed differences in magnitude. Right: correcting for the distance differences leads to the overlapping of selected stars within the CMD supporting the present of the distance gradient.
Current usage metrics show cumulative count of Article Views (full-text article views including HTML views, PDF and ePub downloads, according to the available data) and Abstracts Views on Vision4Press platform.
Data correspond to usage on the plateform after 2015. The current usage metrics is available 48-96 hours after online publication and is updated daily on week days.
Initial download of the metrics may take a while.