Fig. 10
Download original image
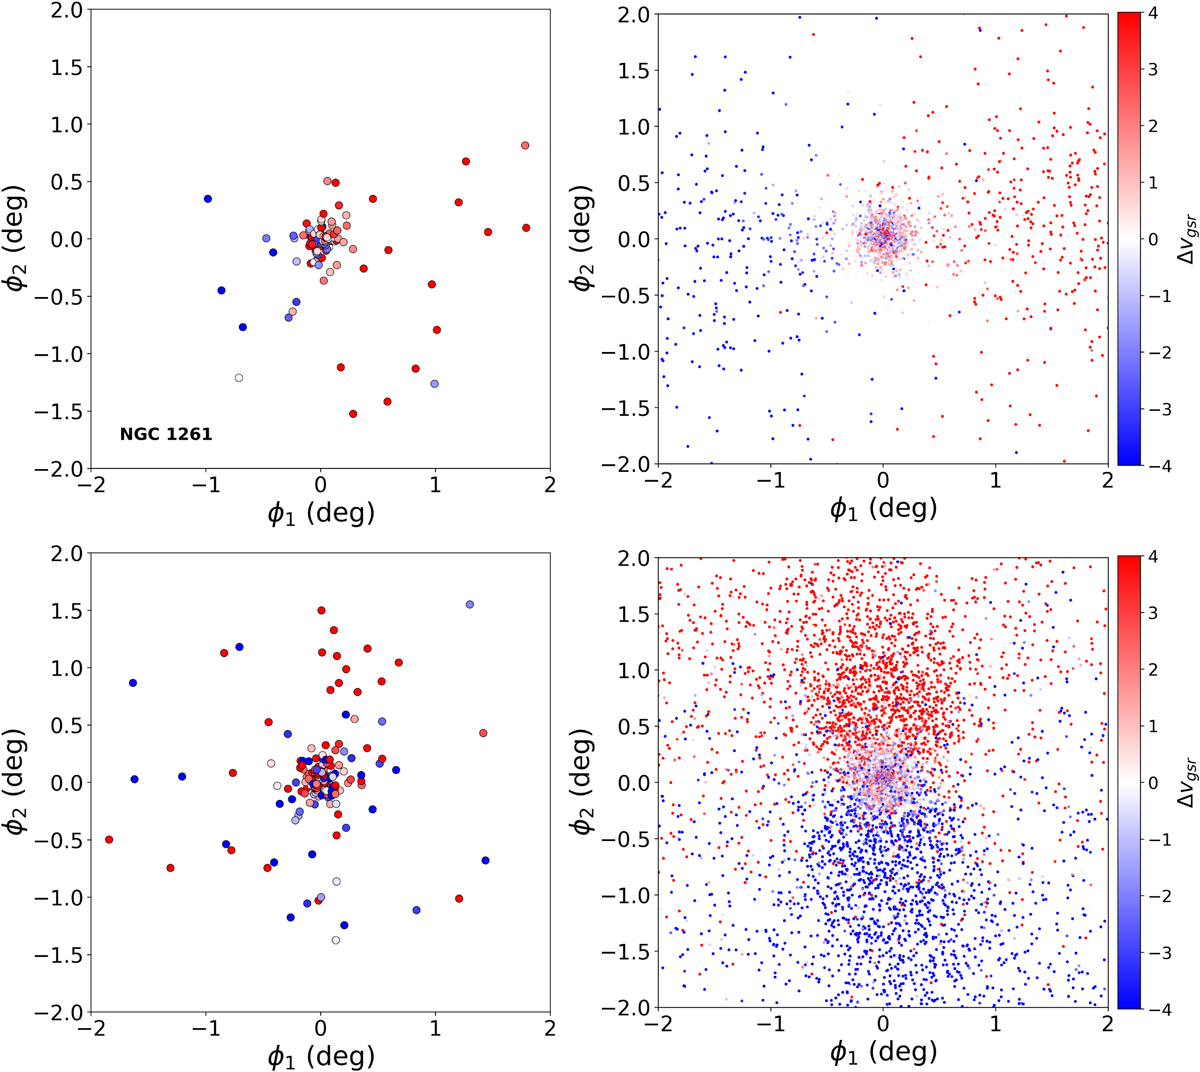
A closer look at the radial velocities in comparison between observed members and simulation predictions. The upper and lower rows refer to NGC 1261 and NGC 1904, respectively. Left panels: potential member stars within ±2° around the clusters coloured by the radial velocity shifted with respect to the radial velocity of the cluster (Δv𝑔sr). Right panels: same property as left panels, but displayed using particles from the N-body simulation.
Current usage metrics show cumulative count of Article Views (full-text article views including HTML views, PDF and ePub downloads, according to the available data) and Abstracts Views on Vision4Press platform.
Data correspond to usage on the plateform after 2015. The current usage metrics is available 48-96 hours after online publication and is updated daily on week days.
Initial download of the metrics may take a while.