Fig. 1
Download original image
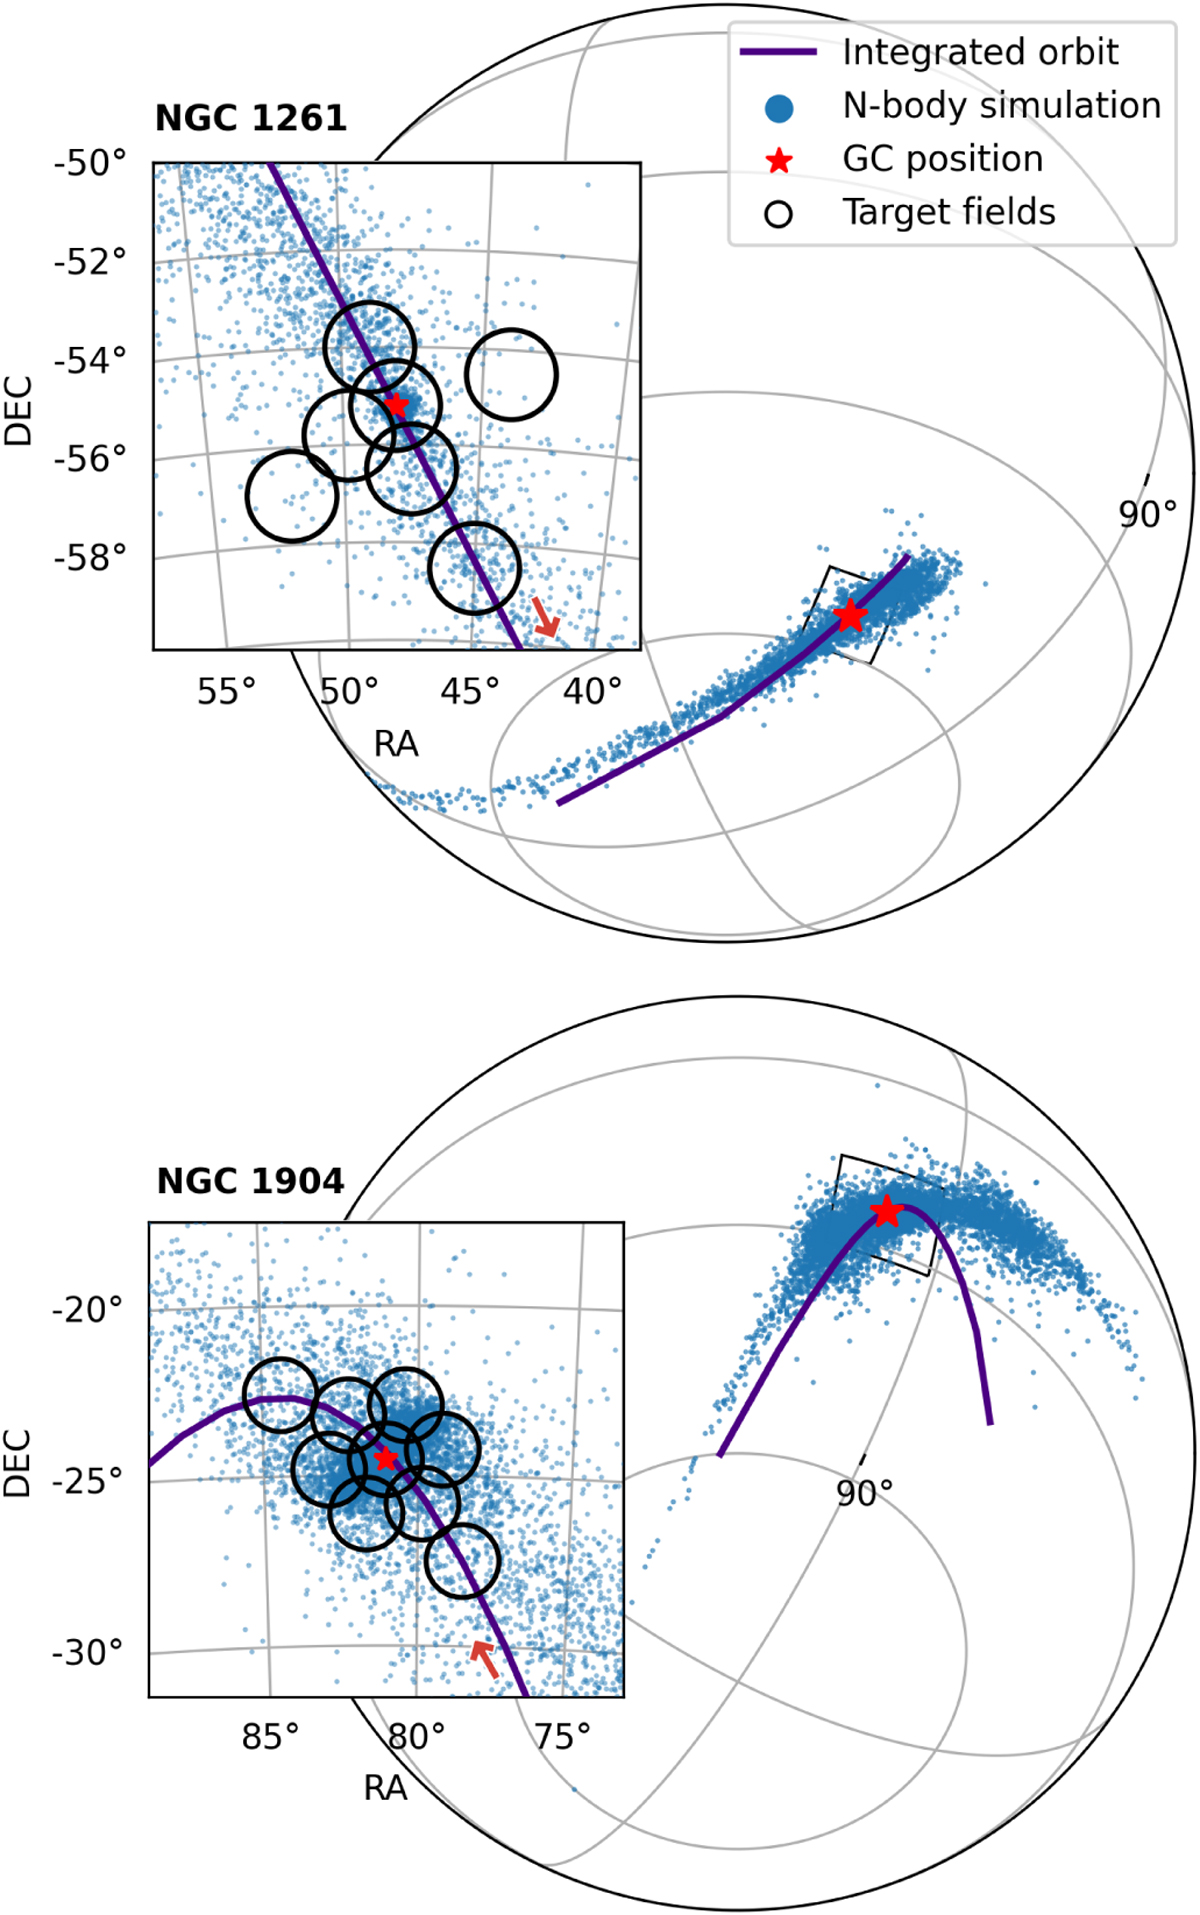
3D sky plots for NGC 1261 (top) and NGC 1904 (bottom). The position of each GC is shown as a red star and the particles from the N-body simulations are shown in blue throughout the paper. The insets show the distribution of particles close to the clusters and the outlines of the fields targeted by S5 (black circles). We also plot in purple the integrated orbit of each GC given the gravitational potential described in Sect. 3.1, and the direction of motion of the cluster is indicated by the red arrow.
Current usage metrics show cumulative count of Article Views (full-text article views including HTML views, PDF and ePub downloads, according to the available data) and Abstracts Views on Vision4Press platform.
Data correspond to usage on the plateform after 2015. The current usage metrics is available 48-96 hours after online publication and is updated daily on week days.
Initial download of the metrics may take a while.