Fig. 5
Download original image
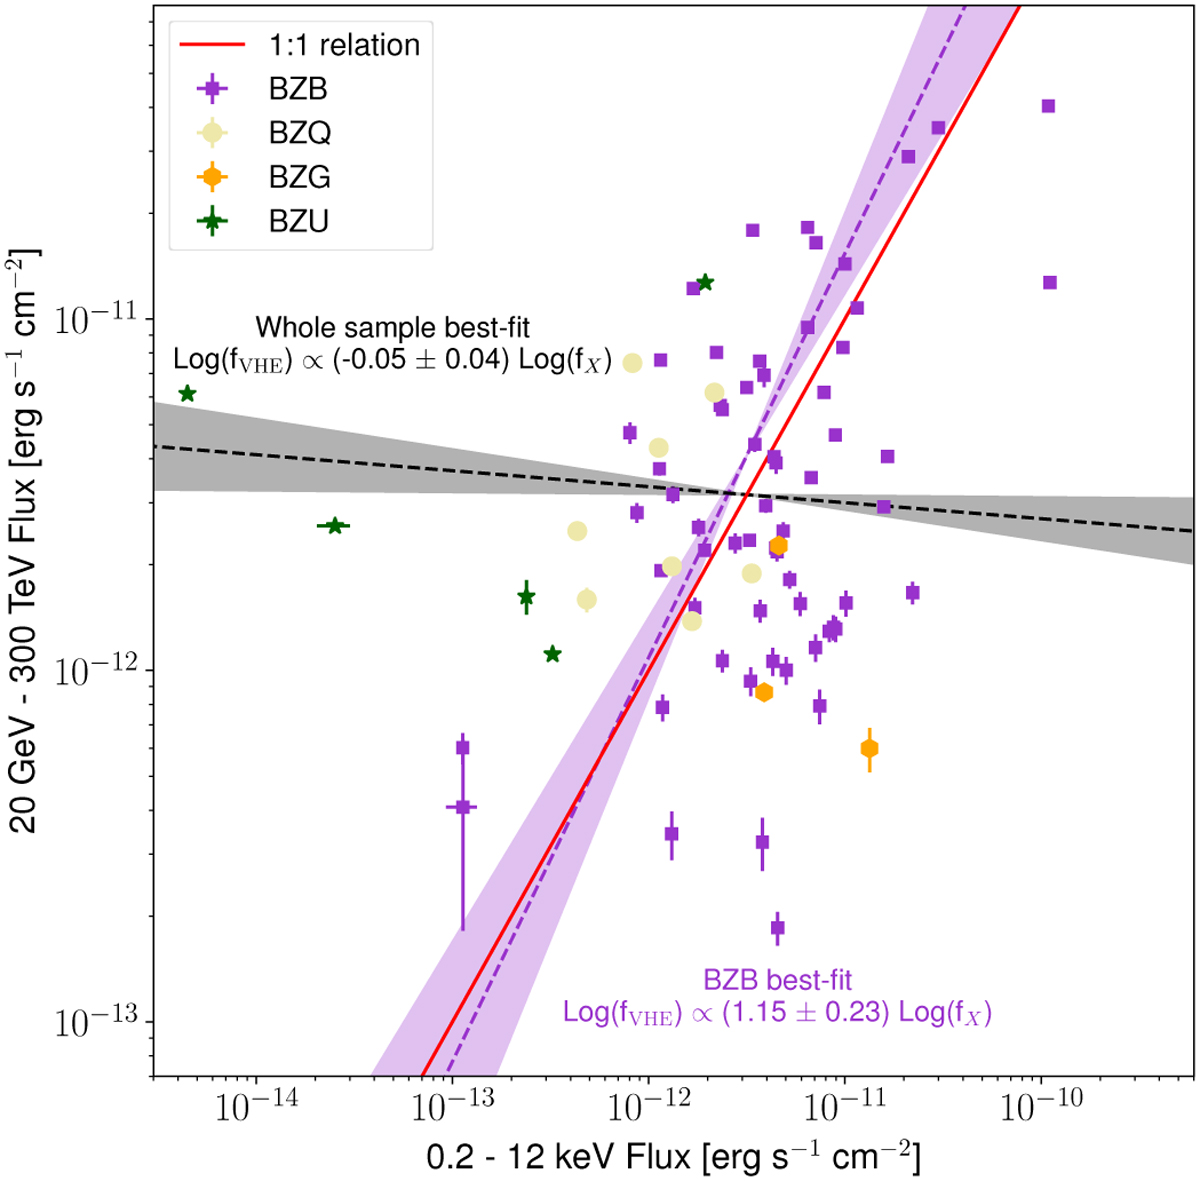
Average 20 GeV–300 TeV flux as a function of the average 0.2–12 keV flux for the 77 TeVCAT sources in our sample. The data points are color-coded according to class, using the same coding as that described in Figure 2. In the plot, we also include the best-fit linear regression between the logarithm of the VHE flux and the logarithm of the X-ray flux, i.e., for the whole sample (dashed black line) and for the BZB subsample (violet dashed line). For reference, we also plot the 1:1 relation (solid black line).
Current usage metrics show cumulative count of Article Views (full-text article views including HTML views, PDF and ePub downloads, according to the available data) and Abstracts Views on Vision4Press platform.
Data correspond to usage on the plateform after 2015. The current usage metrics is available 48-96 hours after online publication and is updated daily on week days.
Initial download of the metrics may take a while.