Open Access
Fig. 4
Download original image
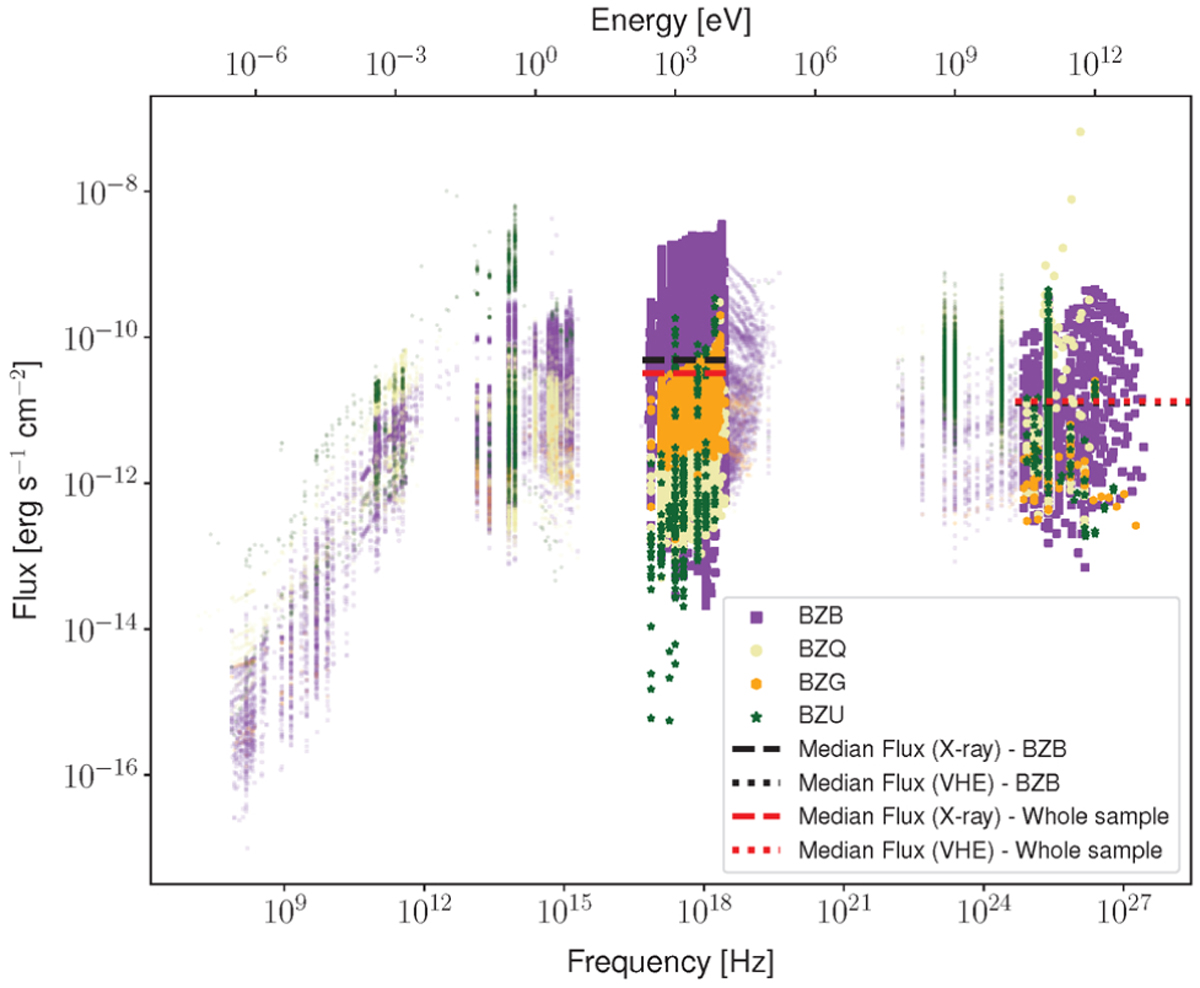
Spectral energy distributions of the 77 TeVCAT sources analyzed in this work. The SEDs are color-coded by class using the same coding described in Figure 2. We also show with black (red) dashed and dotted lines the median 0.2–12 keV and 20 GeV–300 TeV fluxes of the BZB subsample (overall population).
Current usage metrics show cumulative count of Article Views (full-text article views including HTML views, PDF and ePub downloads, according to the available data) and Abstracts Views on Vision4Press platform.
Data correspond to usage on the plateform after 2015. The current usage metrics is available 48-96 hours after online publication and is updated daily on week days.
Initial download of the metrics may take a while.