Fig. 4.
Download original image
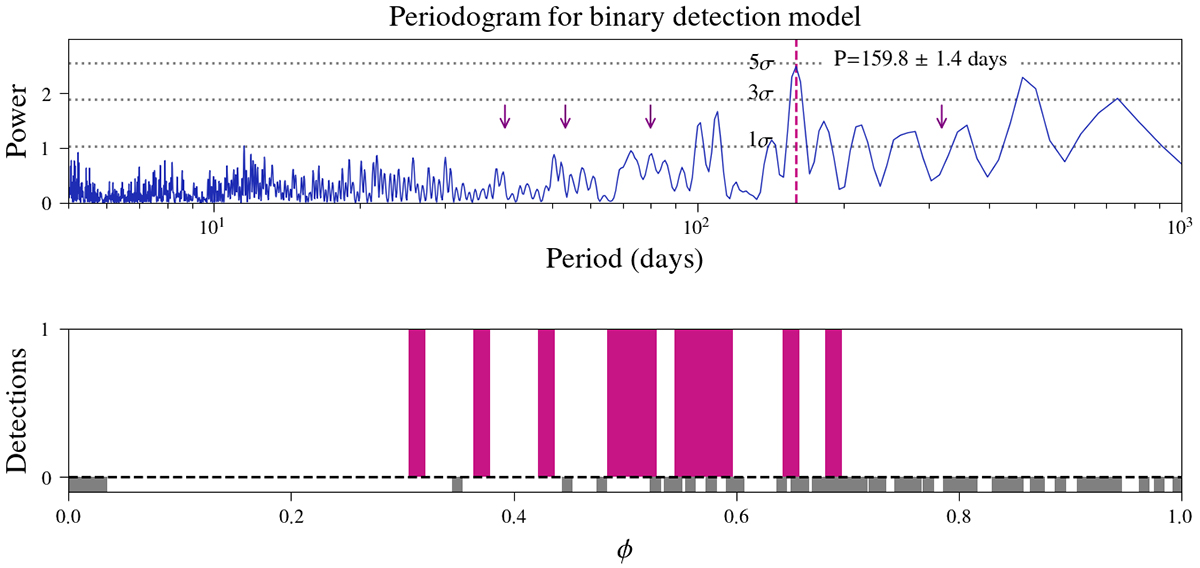
Periodogram for binary detection model. Top: S-band dataset periodogram resulting from the binary model. The periodicity this dataset yields is 159.8 ± 1.4 days. The purple arrows indicate some of the harmonics of the period found. The dotted horizontal lines correspond to the 1σ, 3σ, and 5σ significance levels determined by 10 000 bootstrap resamplings. The peak at 159.8 days is right below a 5σ significance. Bottom: Folding of the observations using the obtained periodicity. In this dataset, more observations are needed to be able to map the full phase domain. Observations with detections are highlighted in magenta and the non-detections in grey. A little height was added to the non-detections for visualisation of phase domain coverage.
Current usage metrics show cumulative count of Article Views (full-text article views including HTML views, PDF and ePub downloads, according to the available data) and Abstracts Views on Vision4Press platform.
Data correspond to usage on the plateform after 2015. The current usage metrics is available 48-96 hours after online publication and is updated daily on week days.
Initial download of the metrics may take a while.