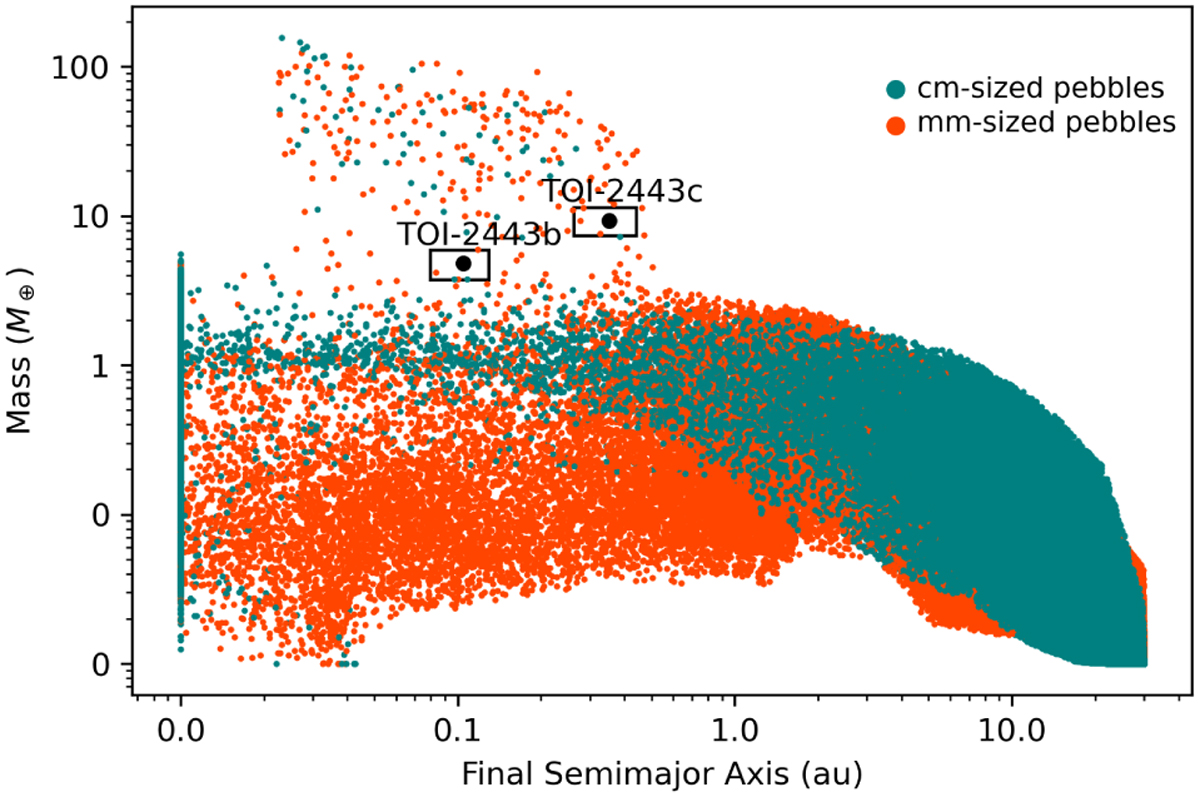
Fig. 9
Download original image
Synthetic populations of planets resulting from the two Monte Carlo runs of 2×10⁵ extractions each with GroMiT. The plot shows the final masses and orbital periods of the simulated growth tracks. The vermilion symbols indicate those planets formed in disks dominated by mm-sized pebbles, while with cactus green we denote cm-sized pebble-dominated disks. Planets b and c are indicated using two larger cyan circles and the boxes around them highlight the region of parameter space populated by the successful solutions.
Current usage metrics show cumulative count of Article Views (full-text article views including HTML views, PDF and ePub downloads, according to the available data) and Abstracts Views on Vision4Press platform.
Data correspond to usage on the plateform after 2015. The current usage metrics is available 48-96 hours after online publication and is updated daily on week days.
Initial download of the metrics may take a while.