Fig. 5
Download original image
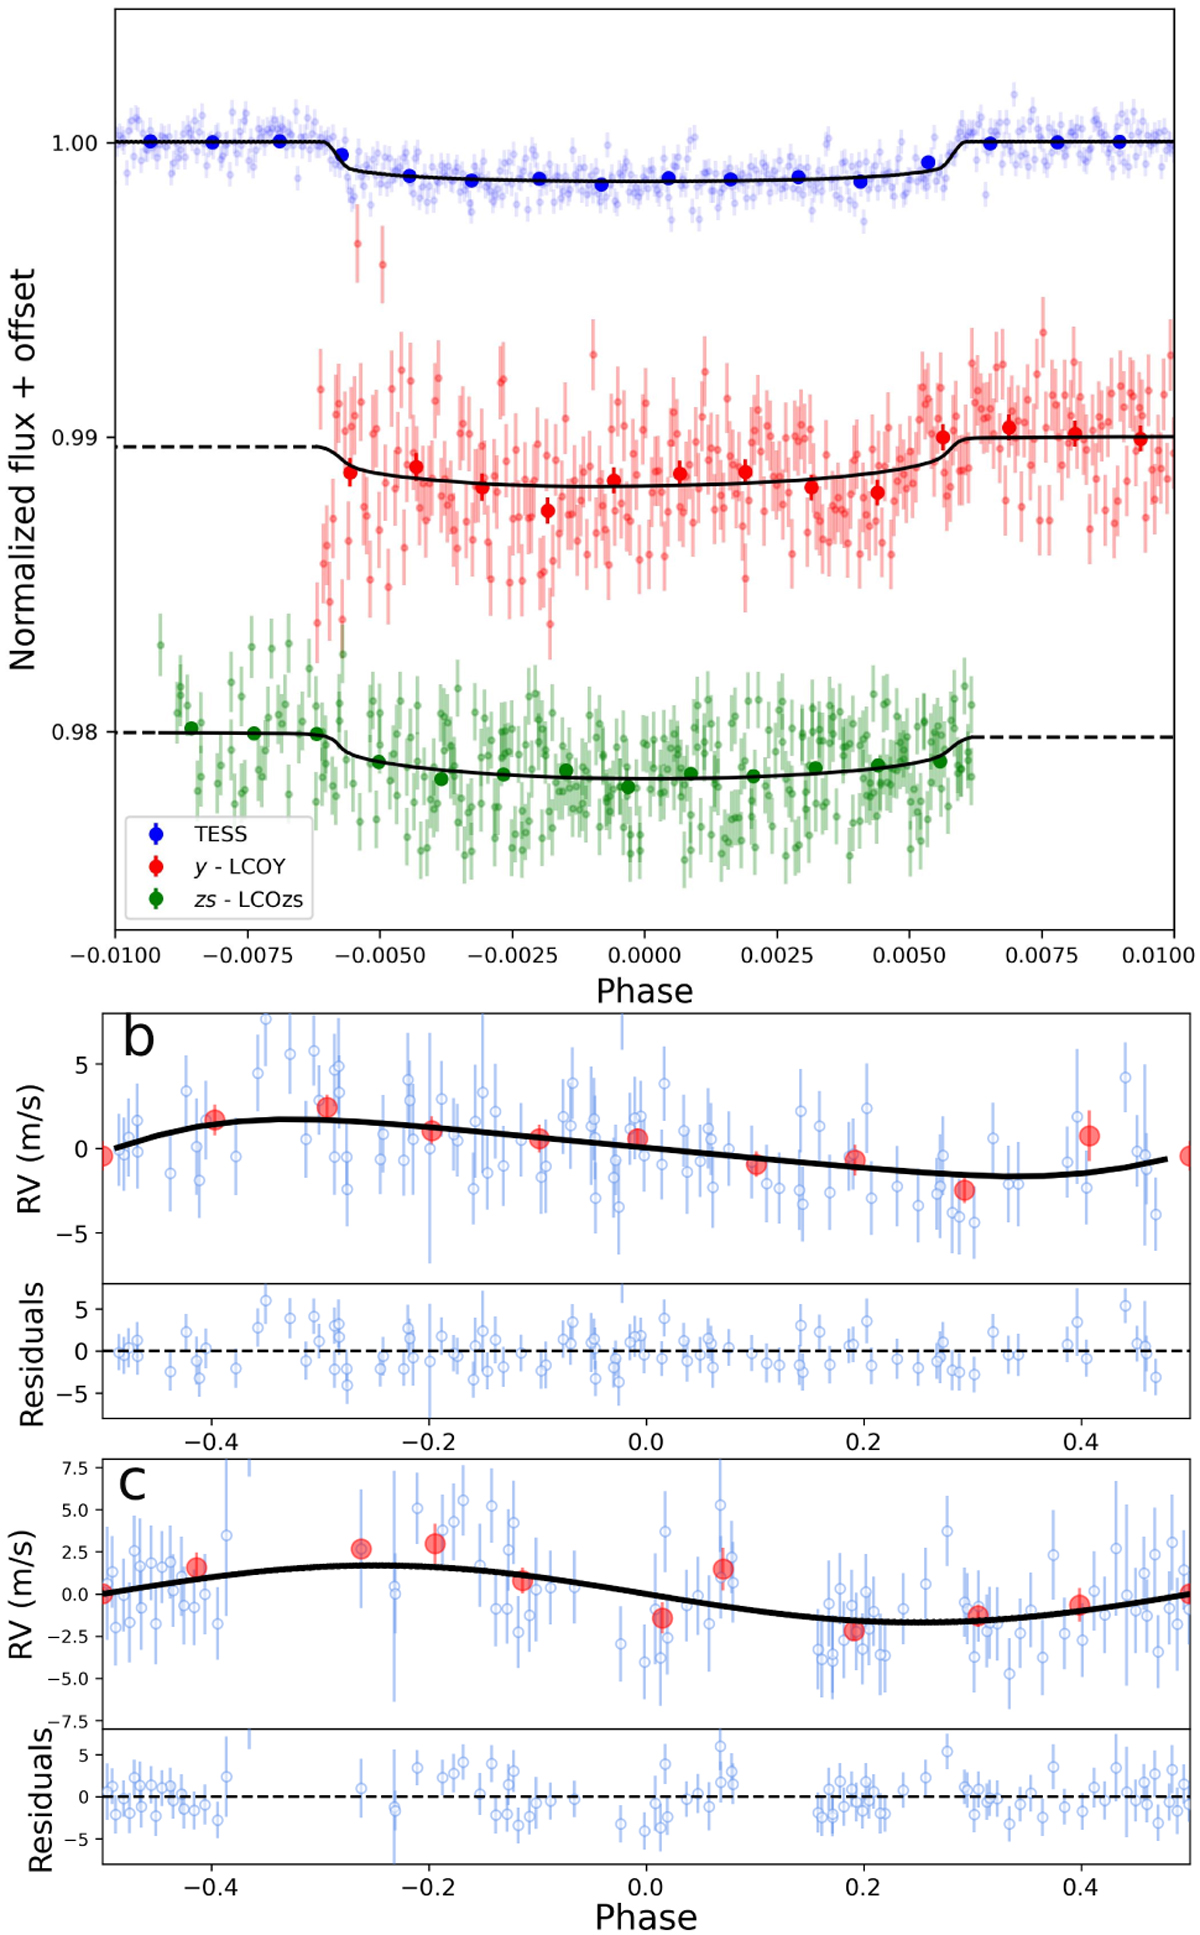
Phase-folded plots. Top panel: global fit result for TESS and the ground-based transits. Both LCOGT light curves are shifted on the y-axis for clarity, and their respective filter band are indicated in the legend, while the superimposed points represent ~30-minute bins. Bottom panels: phase-folded HARPS-N RVs to the period of planet b and candidate c, along with their residuals. The red circles represent the average value of ~10 phased RV data points at a time.
Current usage metrics show cumulative count of Article Views (full-text article views including HTML views, PDF and ePub downloads, according to the available data) and Abstracts Views on Vision4Press platform.
Data correspond to usage on the plateform after 2015. The current usage metrics is available 48-96 hours after online publication and is updated daily on week days.
Initial download of the metrics may take a while.