Fig. 3
Download original image
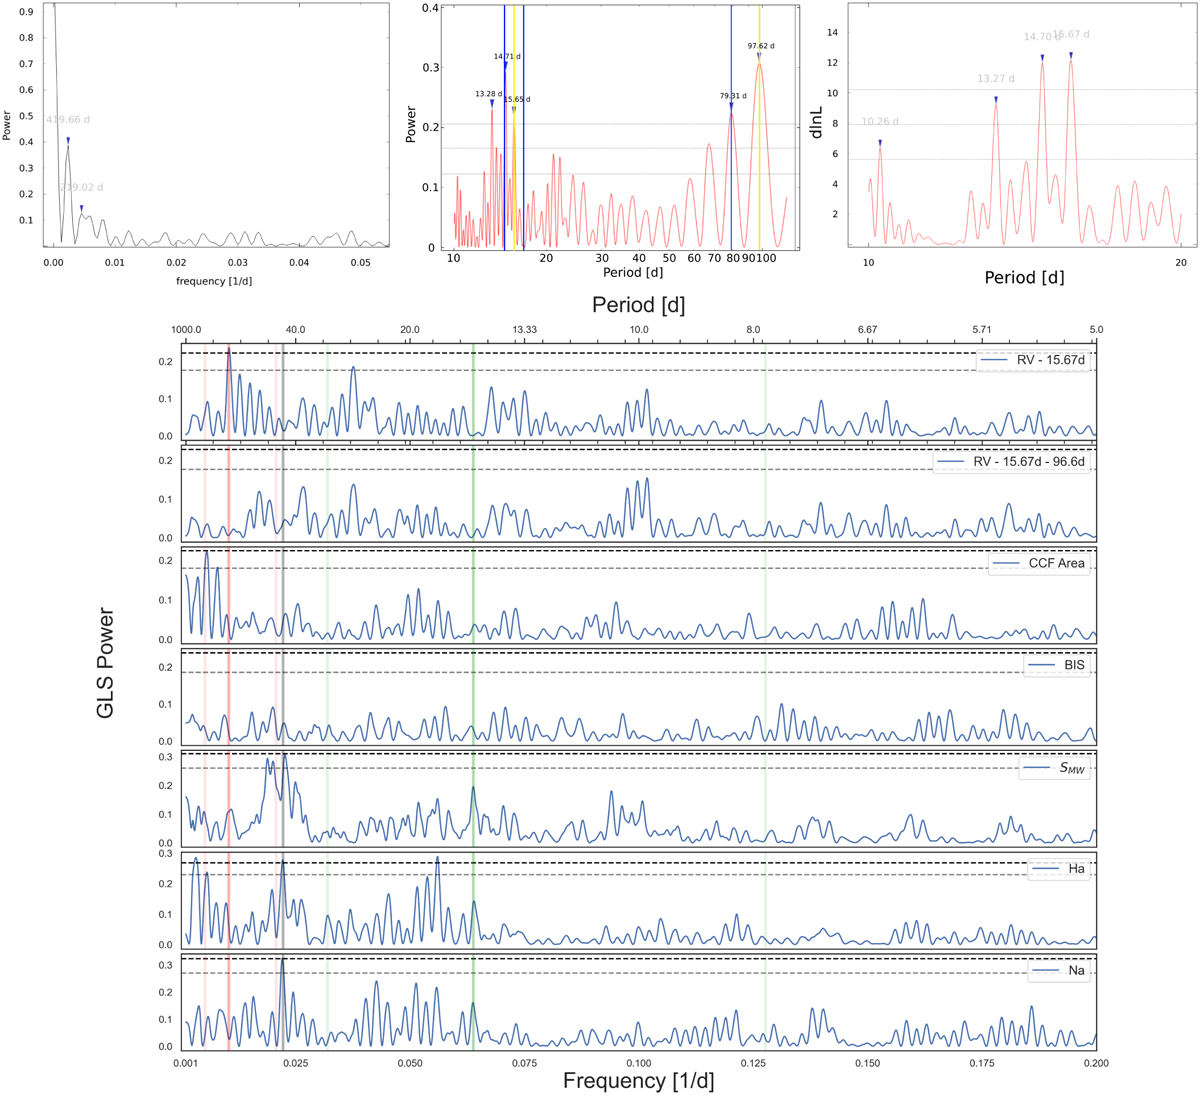
Periodograms. Top row, left panel: window function of HARPS-N RVs, with its highest peaks highlighted. Top row, middle panel: GLS periodogram of HARPS-N RVs. Two yellow vertical lines are drawn at the periodicity of BD+00 444b transits (15.67 days) and the highest peak of the GLS, while their aliases due to the window function (respectively ≈219 and 420 days), are identified by blue vertical lines. Top row, right panel: MLP of HARPS-N RVs between 10 and 20 days, with its major peak identified at precisely 15.67 days. The three horizontal lines represent the FAP levels of 10%, 1%, and 0.1%. Bottom panel: GLS periodogram of the HARPS-N RV residuals of the one-planet and two-planet models (first two rows), and of various activity indices specified in the labels. The main peak of the RV GLS periodogram, which is here identified as the signal of planet candidate BD+00 444c at about 97 d, is highlighted with a red vertical line, while the period of the transiting candidate (15.67 d) and the possible stellar rotation period (45 d) are highlighted in green and gray, respectively. Shaded vertical bars are plotted at 0.5× and 2× the respective signals to emphasize potential aliases. The horizontal dashed lines mark, respectively, the 10% and 1% confidence levels (evaluated with the bootstrap method).
Current usage metrics show cumulative count of Article Views (full-text article views including HTML views, PDF and ePub downloads, according to the available data) and Abstracts Views on Vision4Press platform.
Data correspond to usage on the plateform after 2015. The current usage metrics is available 48-96 hours after online publication and is updated daily on week days.
Initial download of the metrics may take a while.