Fig. 3
Download original image
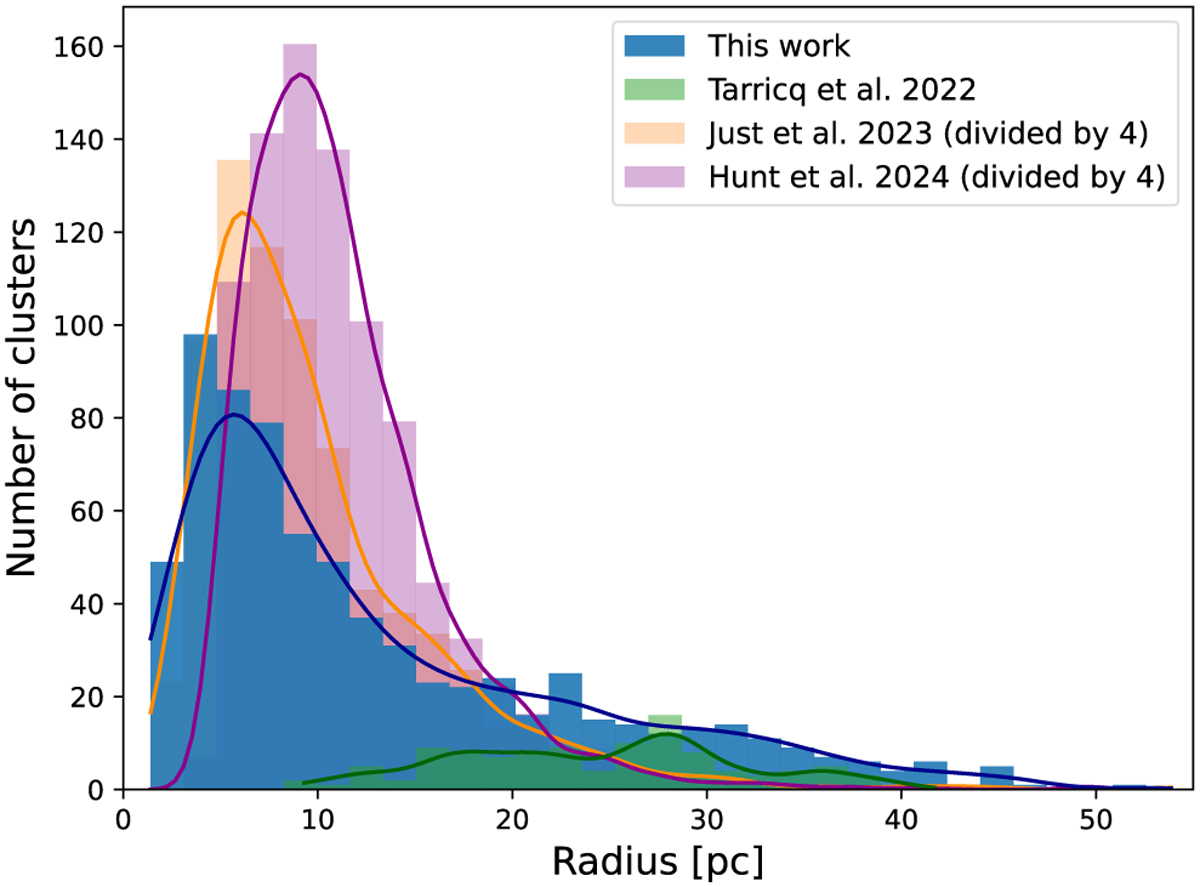
Radii distributions from this work (blue), Tarricq et al. (2022) (green), Hunt & Reffert (2024) (purple), and Just et al. (2023) (orange). KDEs are shown as solid lines. The distributions from Hunt & Reffert (2024) and Just et al. (2023) were divided by four to enable comparison, as the number of OCs is much higher than in the other catalogues.
Current usage metrics show cumulative count of Article Views (full-text article views including HTML views, PDF and ePub downloads, according to the available data) and Abstracts Views on Vision4Press platform.
Data correspond to usage on the plateform after 2015. The current usage metrics is available 48-96 hours after online publication and is updated daily on week days.
Initial download of the metrics may take a while.