Fig. 2
Download original image
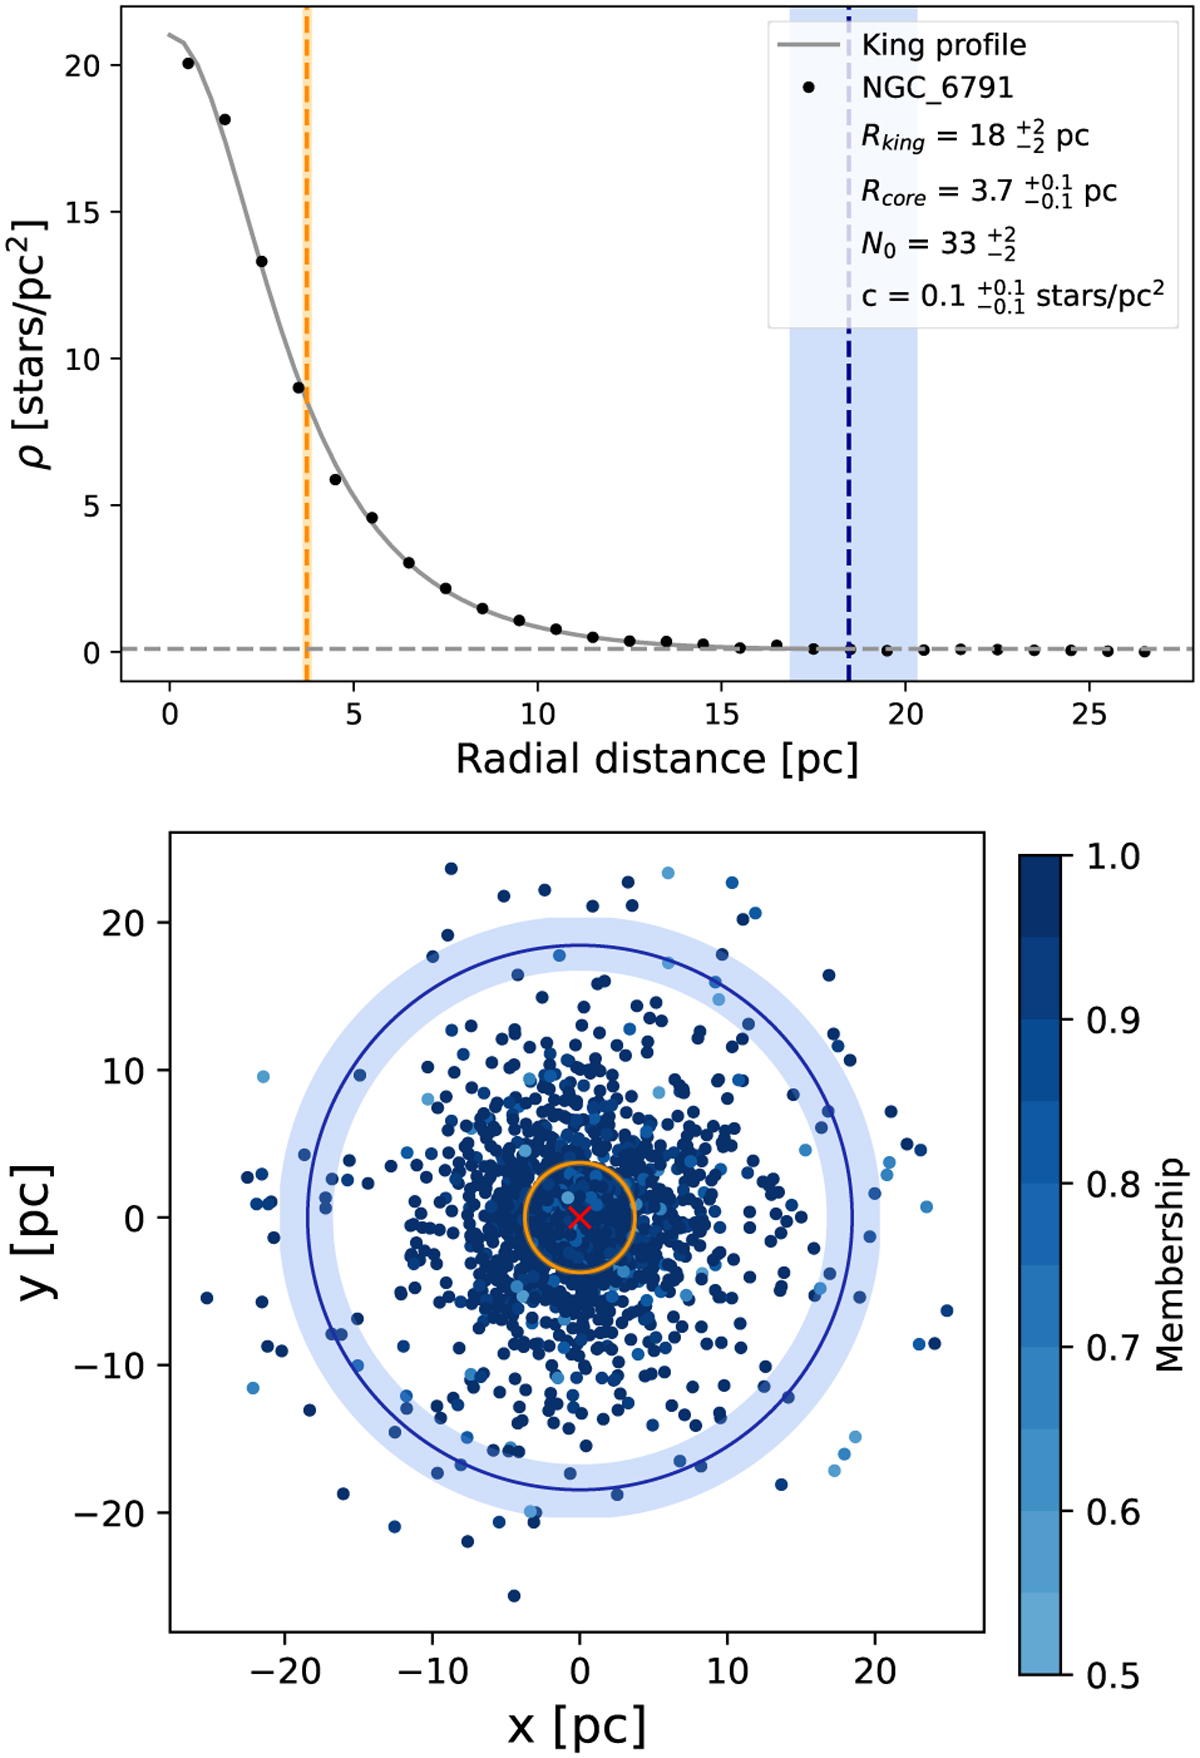
Example of classification R1. (Top) Radial density distribution of OC NGC 6791 (black points) with a fitted King profile (grey solid line). Blue and orange vertical dashed lines represent the King and core radius, respectively. The upper and lower uncertainty of each radius are displayed as the shaded area around each vertical line. The grey horizontal dashed line represents parameter c, which is the background density. (Bottom) Spatial distribution of the cluster stars onto the tangent plane colour-coded by membership probability. Blue and orange circles are at the King and core radius, respectively.
Current usage metrics show cumulative count of Article Views (full-text article views including HTML views, PDF and ePub downloads, according to the available data) and Abstracts Views on Vision4Press platform.
Data correspond to usage on the plateform after 2015. The current usage metrics is available 48-96 hours after online publication and is updated daily on week days.
Initial download of the metrics may take a while.