Open Access
Fig. 18
Download original image
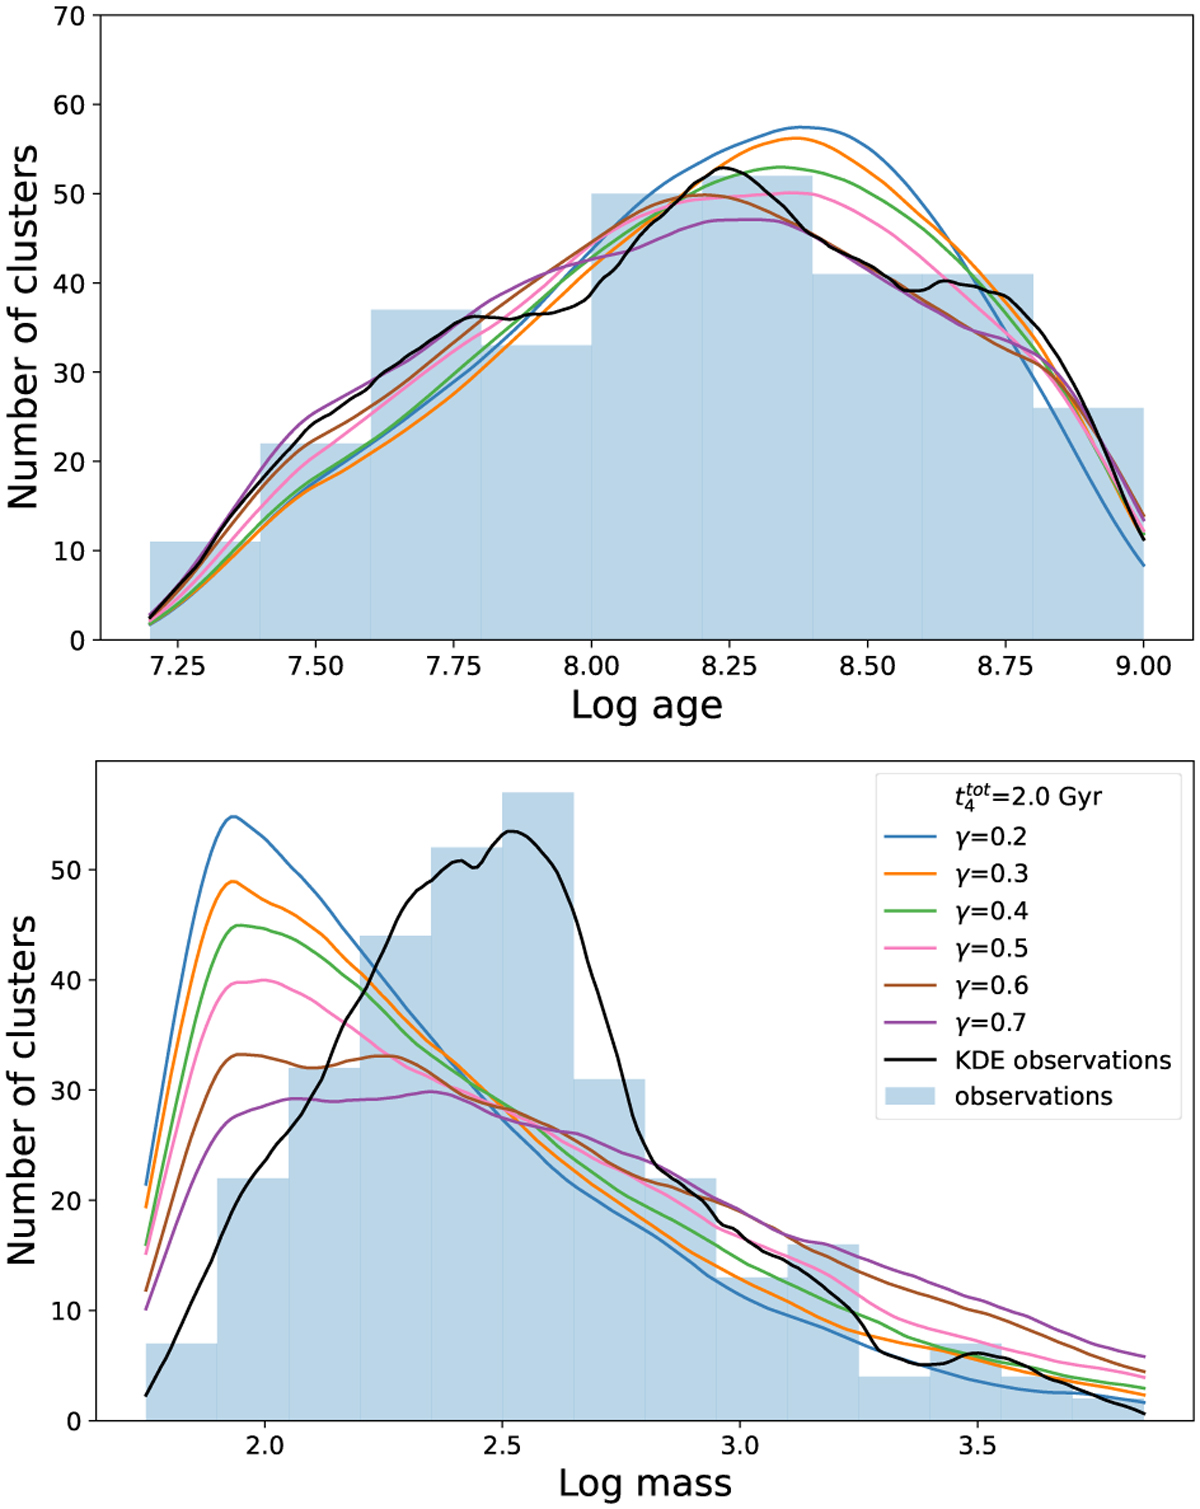
Comparison of the distribution of age (top) and mass (bottom) between the simulations (colour-coded KDEs) and the observations (blue histogram with fitted black KDE) considering ![]() Gyr and γ from 0.2 to 0.7 using the ICMF from Trujillo-Gomez et al. (2019).
Gyr and γ from 0.2 to 0.7 using the ICMF from Trujillo-Gomez et al. (2019).
Current usage metrics show cumulative count of Article Views (full-text article views including HTML views, PDF and ePub downloads, according to the available data) and Abstracts Views on Vision4Press platform.
Data correspond to usage on the plateform after 2015. The current usage metrics is available 48-96 hours after online publication and is updated daily on week days.
Initial download of the metrics may take a while.