Open Access
Fig. 1
Download original image
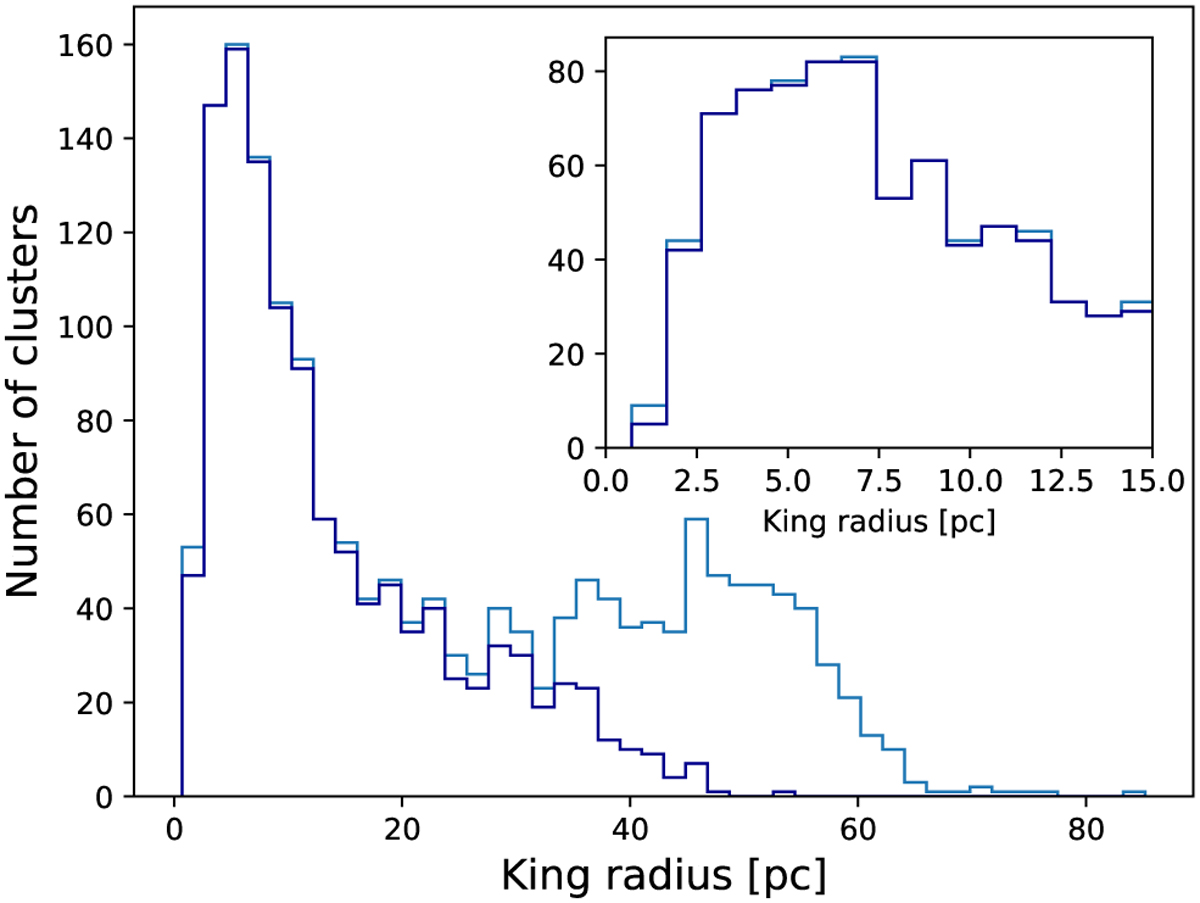
Distribution of King radii for 1724 OCs (in light blue). The dark blue histogram represents the distribution of King radii excluding clusters with poor quality fits (classified as R4; see Sect. 4.1.1). Bin widths were set using Knuth’s rule (Knuth 2006).
Current usage metrics show cumulative count of Article Views (full-text article views including HTML views, PDF and ePub downloads, according to the available data) and Abstracts Views on Vision4Press platform.
Data correspond to usage on the plateform after 2015. The current usage metrics is available 48-96 hours after online publication and is updated daily on week days.
Initial download of the metrics may take a while.