Fig. 2.
Download original image
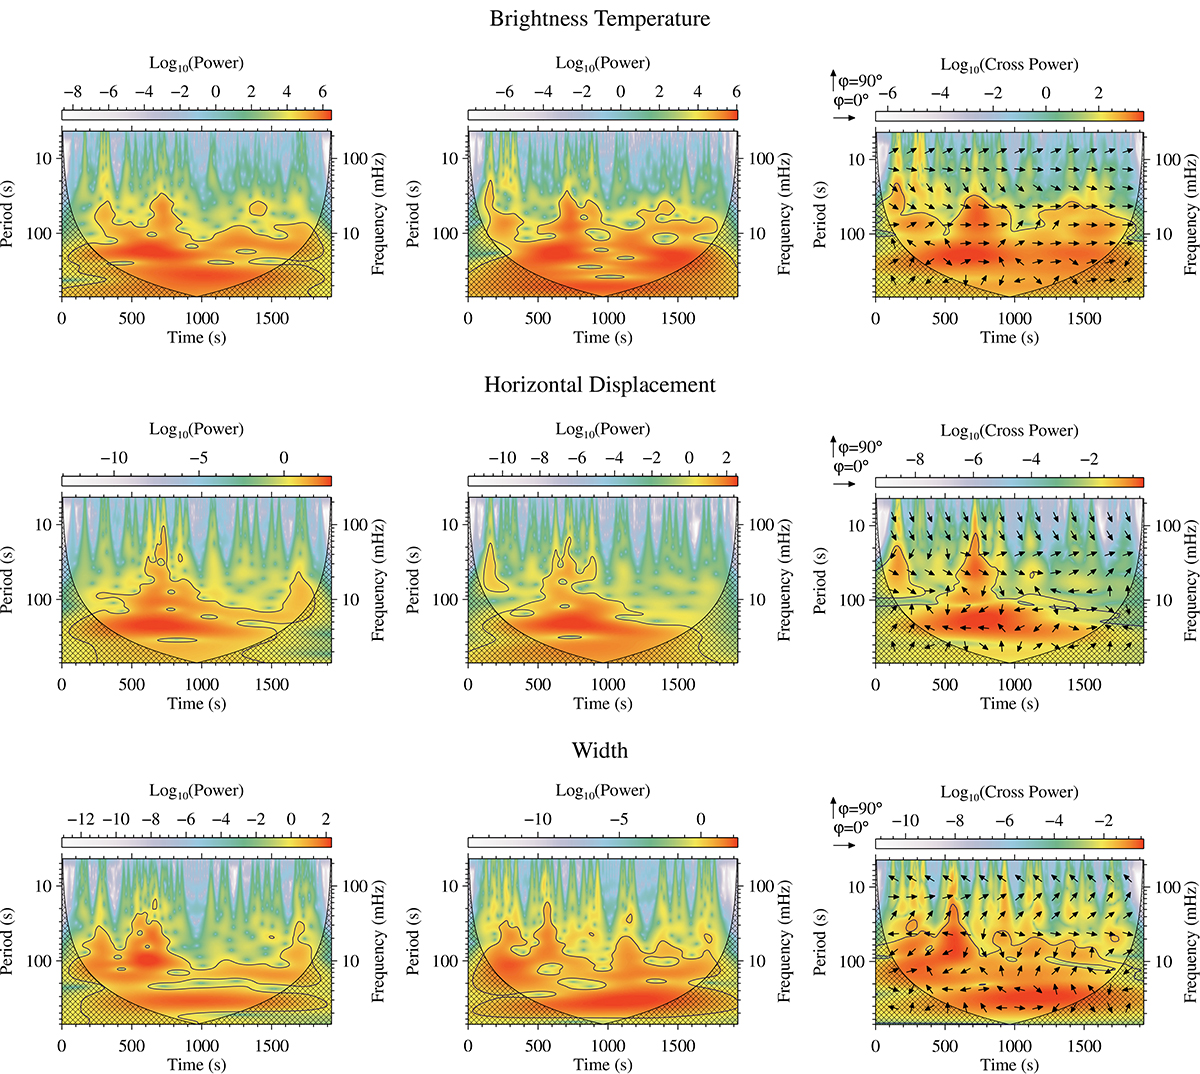
Wavelet power spectra (left and middle columns) and wavelet cross-power spectra (right column) for oscillations in brightness temperature (top row), horizontal displacement (middle row), and width (bottom row) at two consecutive slits along the fibril. The cross-hatched areas indicate the wavelet’s cone of influence. In the cross-power spectra, arrows represent the phase relationship between oscillations at the two slits: rightward arrows indicate in-phase oscillations (0°), leftward arrows indicate antiphase oscillations (180°), and downward arrows indicate the second slit leading the first by 90°. Black contours in all panels mark the 95% confidence level.
Current usage metrics show cumulative count of Article Views (full-text article views including HTML views, PDF and ePub downloads, according to the available data) and Abstracts Views on Vision4Press platform.
Data correspond to usage on the plateform after 2015. The current usage metrics is available 48-96 hours after online publication and is updated daily on week days.
Initial download of the metrics may take a while.