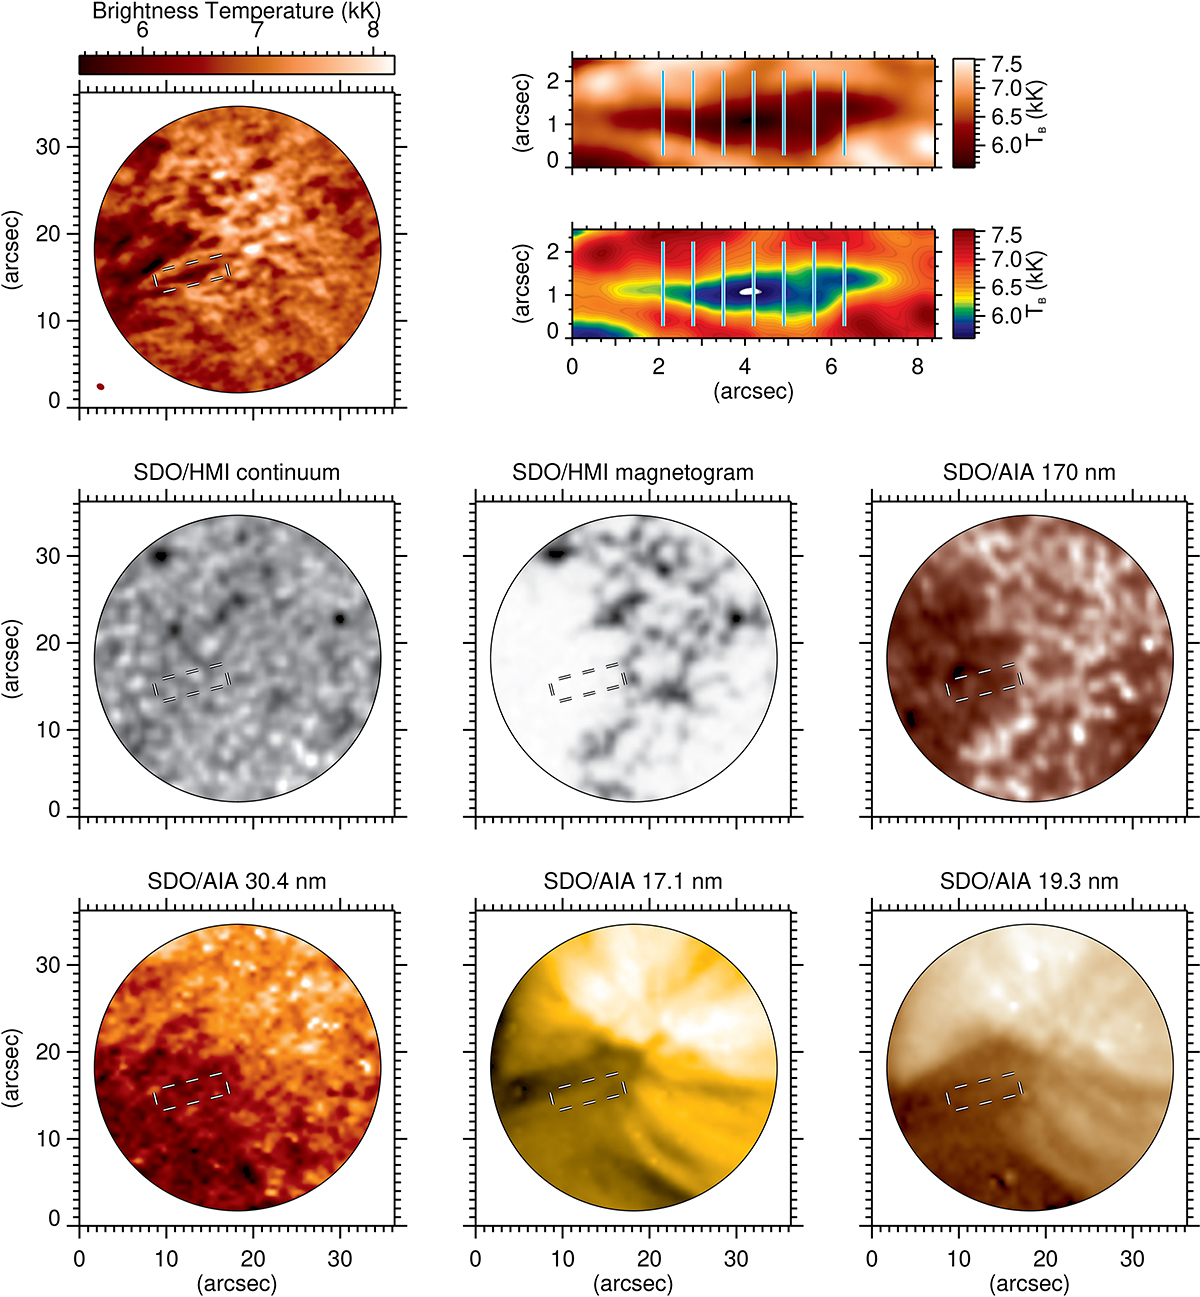
Fig. 1.
Download original image
Upper left panel: A brightness temperature (TB) map from ALMA’s Band 6 observation of the plage region at the start of the time series. The ellipse in the bottom left corner of the panel represents the beam size of the observations and the dashed white rectangle outlines the location of the long-lived fibril of interest. Upper right panel: Zoomed-in view of the selected fibril (using two different color tables for better clarity) with the seven artificial slits placed perpendicular to the fibril axis for wave analysis as discussed in Sect. 3. Middle and lower panels: Co-aligned SDO/HMI continuum and magnetogram and SDO/AIA images at 170, 30.4, 17.1, and 19.3 nm. In the SDO/HMI magnetogram, the line-of-sight photospheric magnetic fields (Blos) are in range of −1116 < Blos (G) < 81.
Current usage metrics show cumulative count of Article Views (full-text article views including HTML views, PDF and ePub downloads, according to the available data) and Abstracts Views on Vision4Press platform.
Data correspond to usage on the plateform after 2015. The current usage metrics is available 48-96 hours after online publication and is updated daily on week days.
Initial download of the metrics may take a while.