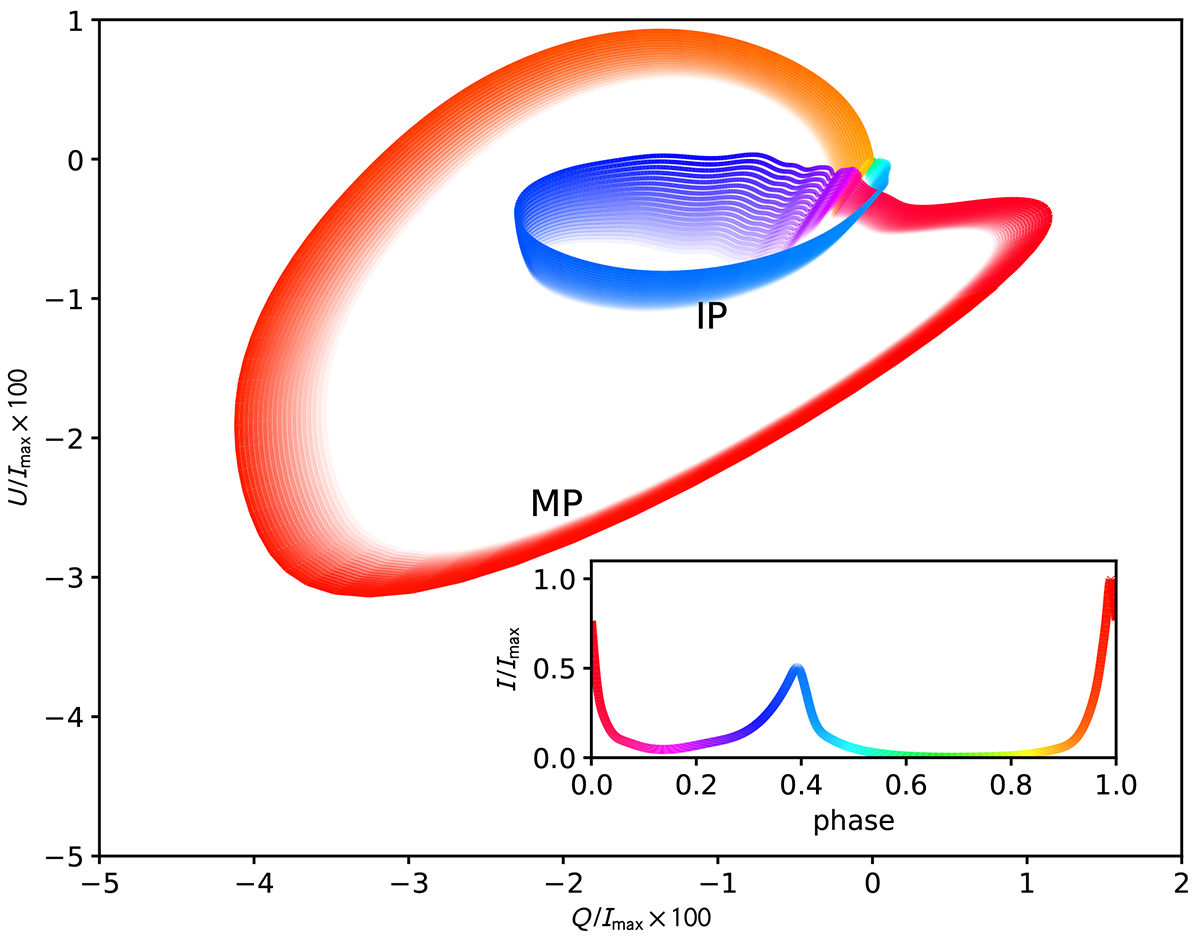
Fig. 8.
Download original image
Stokes parameters Q and U for the pulsar alone, extracted from the phenomenological model fit to IXPE data, without phase shifts in the polarization angle. The color gradient corresponds to the pulse phase, as shown in the subplot for the pulse profile (observed by Chandra). The transparency gradient corresponds to different DC subtractions from the optical Stokes, ranging from 0% subtraction for the most transparent curve to 90% subtraction for the least transparent curve (correspondingly, β/α ranges from 0.46 to 0.56; see Section 3 for more details).
Current usage metrics show cumulative count of Article Views (full-text article views including HTML views, PDF and ePub downloads, according to the available data) and Abstracts Views on Vision4Press platform.
Data correspond to usage on the plateform after 2015. The current usage metrics is available 48-96 hours after online publication and is updated daily on week days.
Initial download of the metrics may take a while.