Open Access
Fig. B.1.
Download original image
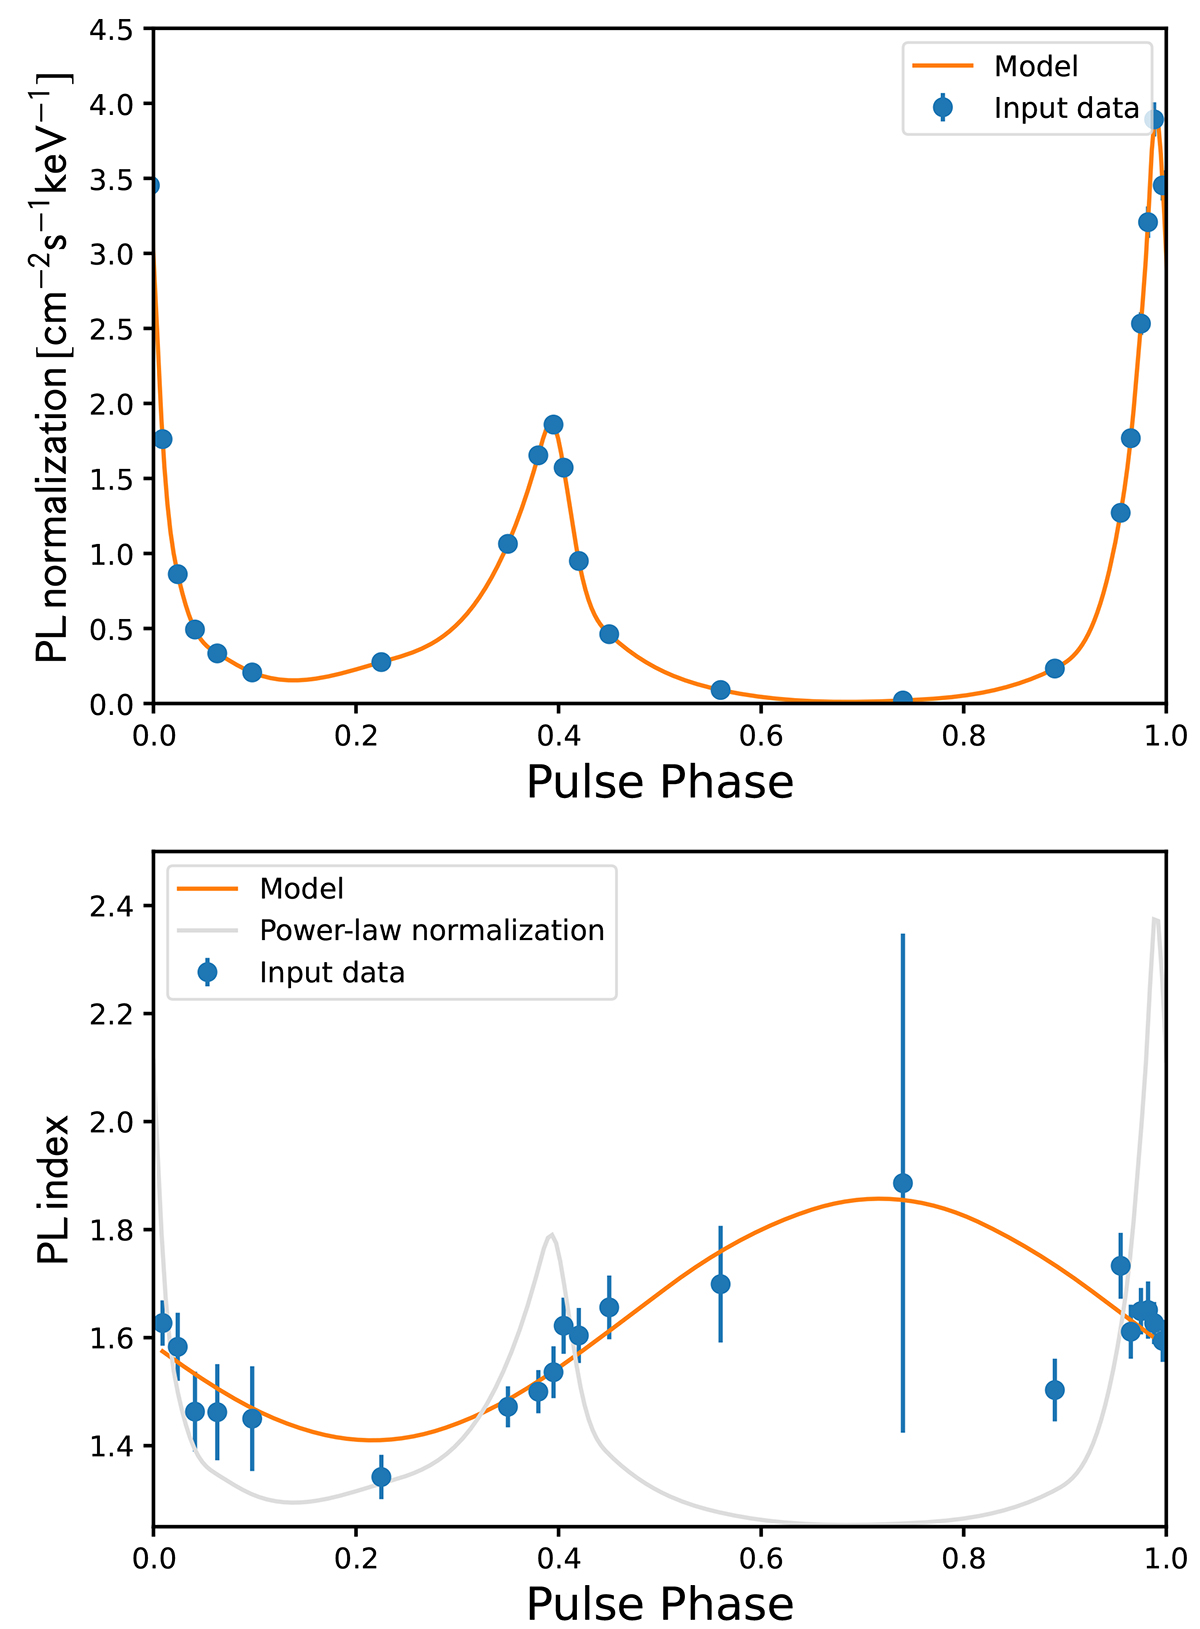
Power-law normalization and index for the phase-dependent spectrum of Crab pulsar in soft X-rays. Data points (in blue) are taken from Weisskopf et al. (2011). The orange curve in the first and second panel correspond to a spline interpolation and a sinusoidal fit, respectively.
Current usage metrics show cumulative count of Article Views (full-text article views including HTML views, PDF and ePub downloads, according to the available data) and Abstracts Views on Vision4Press platform.
Data correspond to usage on the plateform after 2015. The current usage metrics is available 48-96 hours after online publication and is updated daily on week days.
Initial download of the metrics may take a while.