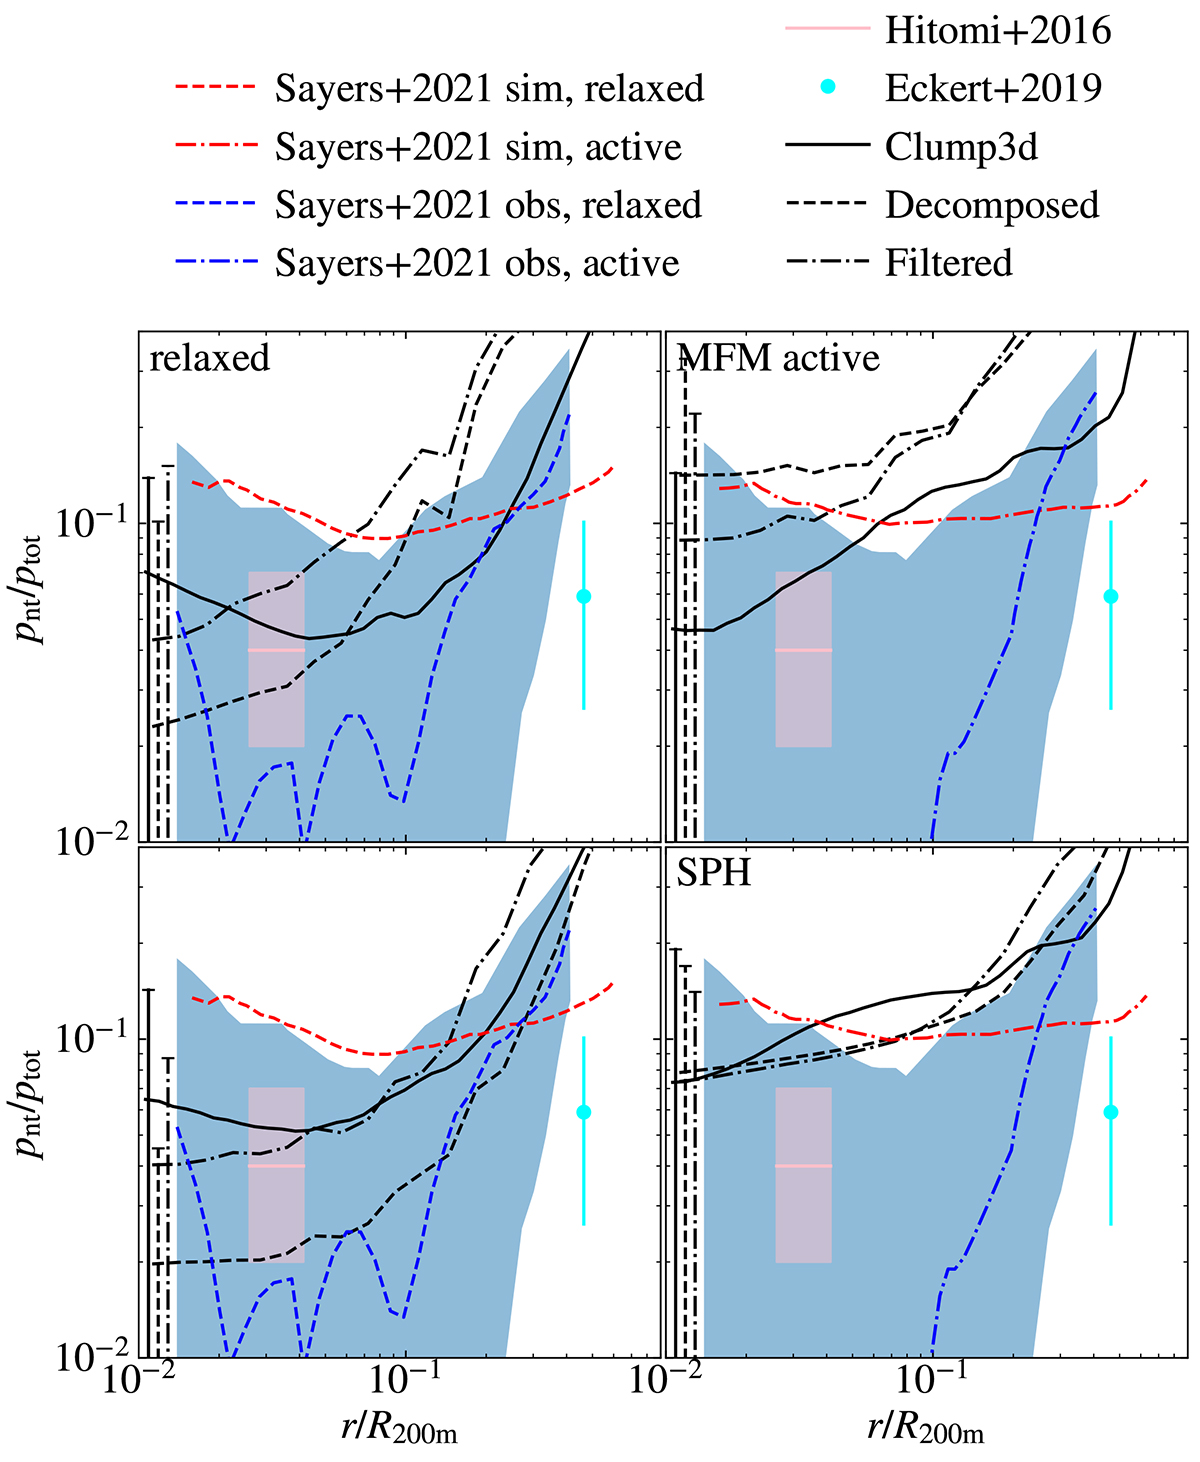
Fig. 8.
Download original image
Turbulent pressure profile averaged over all clusters and redshifts 0.43 ≥ z ≥ 0. The sample was split between dynamical states and hydro-methods used for the simulation, shown in the different panels. The solid line shows the results for the Clump3d analysis, the dashed line the pressure resulting from the solenoidal velocity component using the Helmholtz-decomposed velocity, and the dash-dotted line results from the multi-scale filtering. The typical uncertainty is on the order of σ = 0.08 and indicated for each method with an error bar on the left of each panel.
Current usage metrics show cumulative count of Article Views (full-text article views including HTML views, PDF and ePub downloads, according to the available data) and Abstracts Views on Vision4Press platform.
Data correspond to usage on the plateform after 2015. The current usage metrics is available 48-96 hours after online publication and is updated daily on week days.
Initial download of the metrics may take a while.