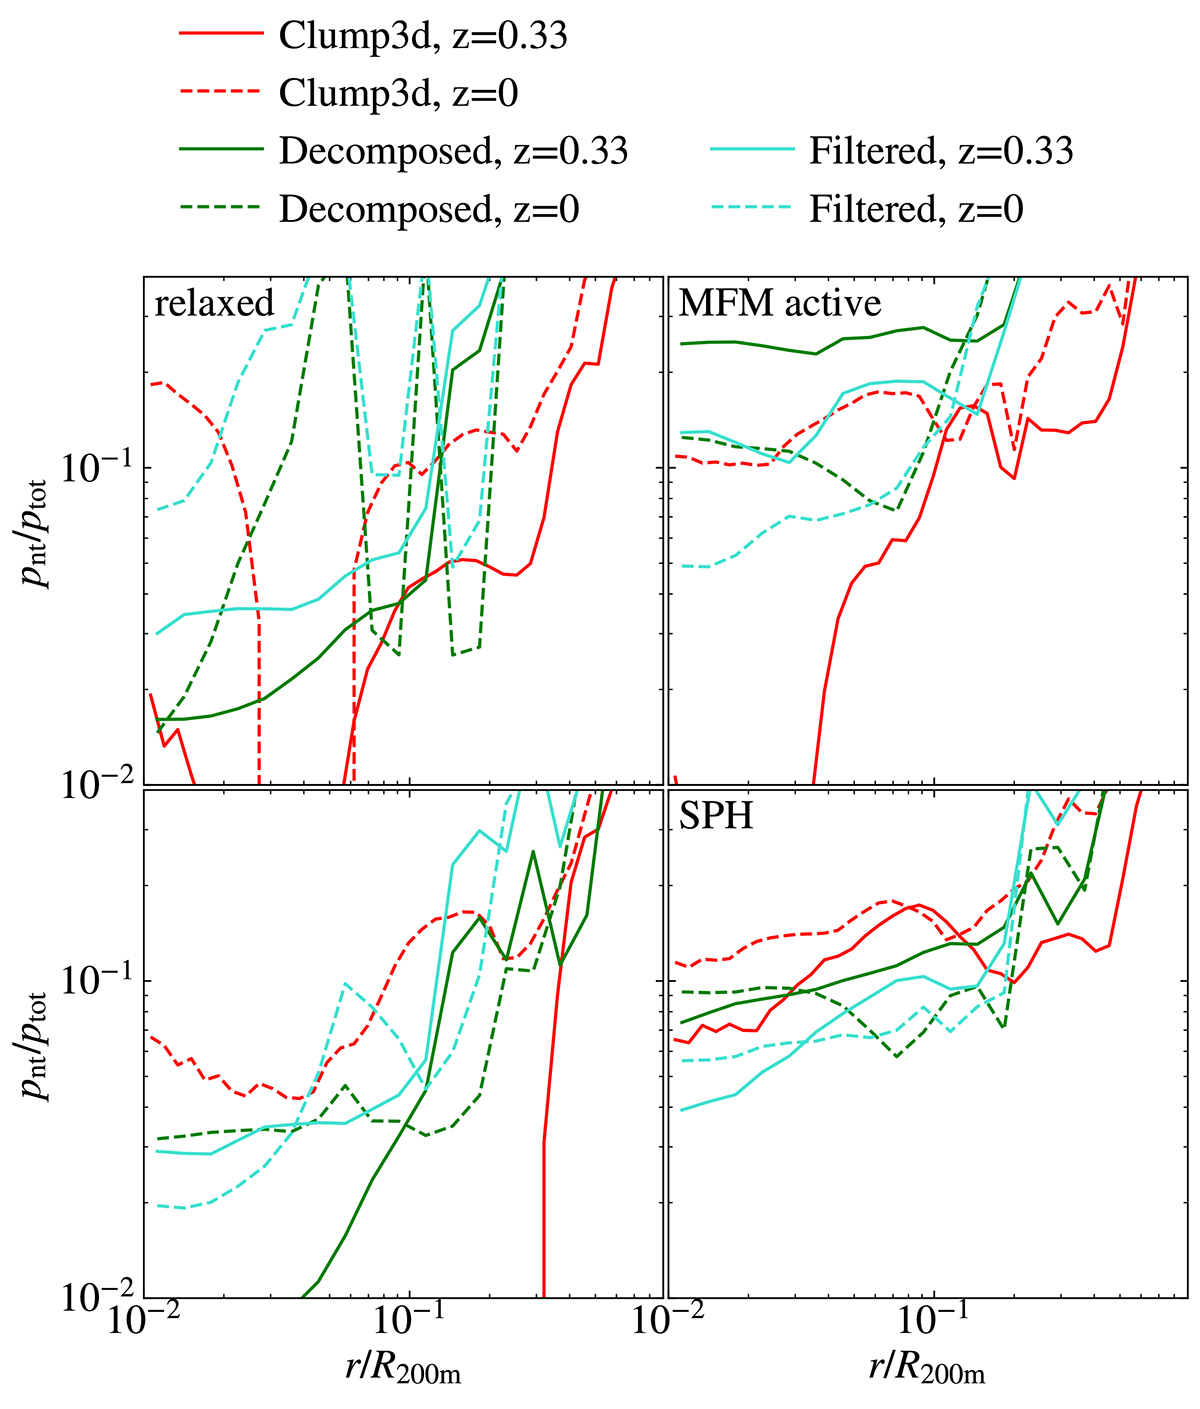
Fig. 7.
Download original image
Turbulent pressure profile averaged over all clusters at redshifts z = 0.33 and z = 0, comparing the three analysis methods: the clump3d method, the solenoidal velocity component, and the multi-scale filtered velocity. The sample is split between dynamical states (left column: relaxed, right column: active) and hydro-methods (top row: MFM, bottom row: SPH) used for the simulation. The linestyle indicates the redshift, the color the analysis method. As only seven clusters were used for averaging, a strong scatter between individual clusters dominates the uncertainty.
Current usage metrics show cumulative count of Article Views (full-text article views including HTML views, PDF and ePub downloads, according to the available data) and Abstracts Views on Vision4Press platform.
Data correspond to usage on the plateform after 2015. The current usage metrics is available 48-96 hours after online publication and is updated daily on week days.
Initial download of the metrics may take a while.