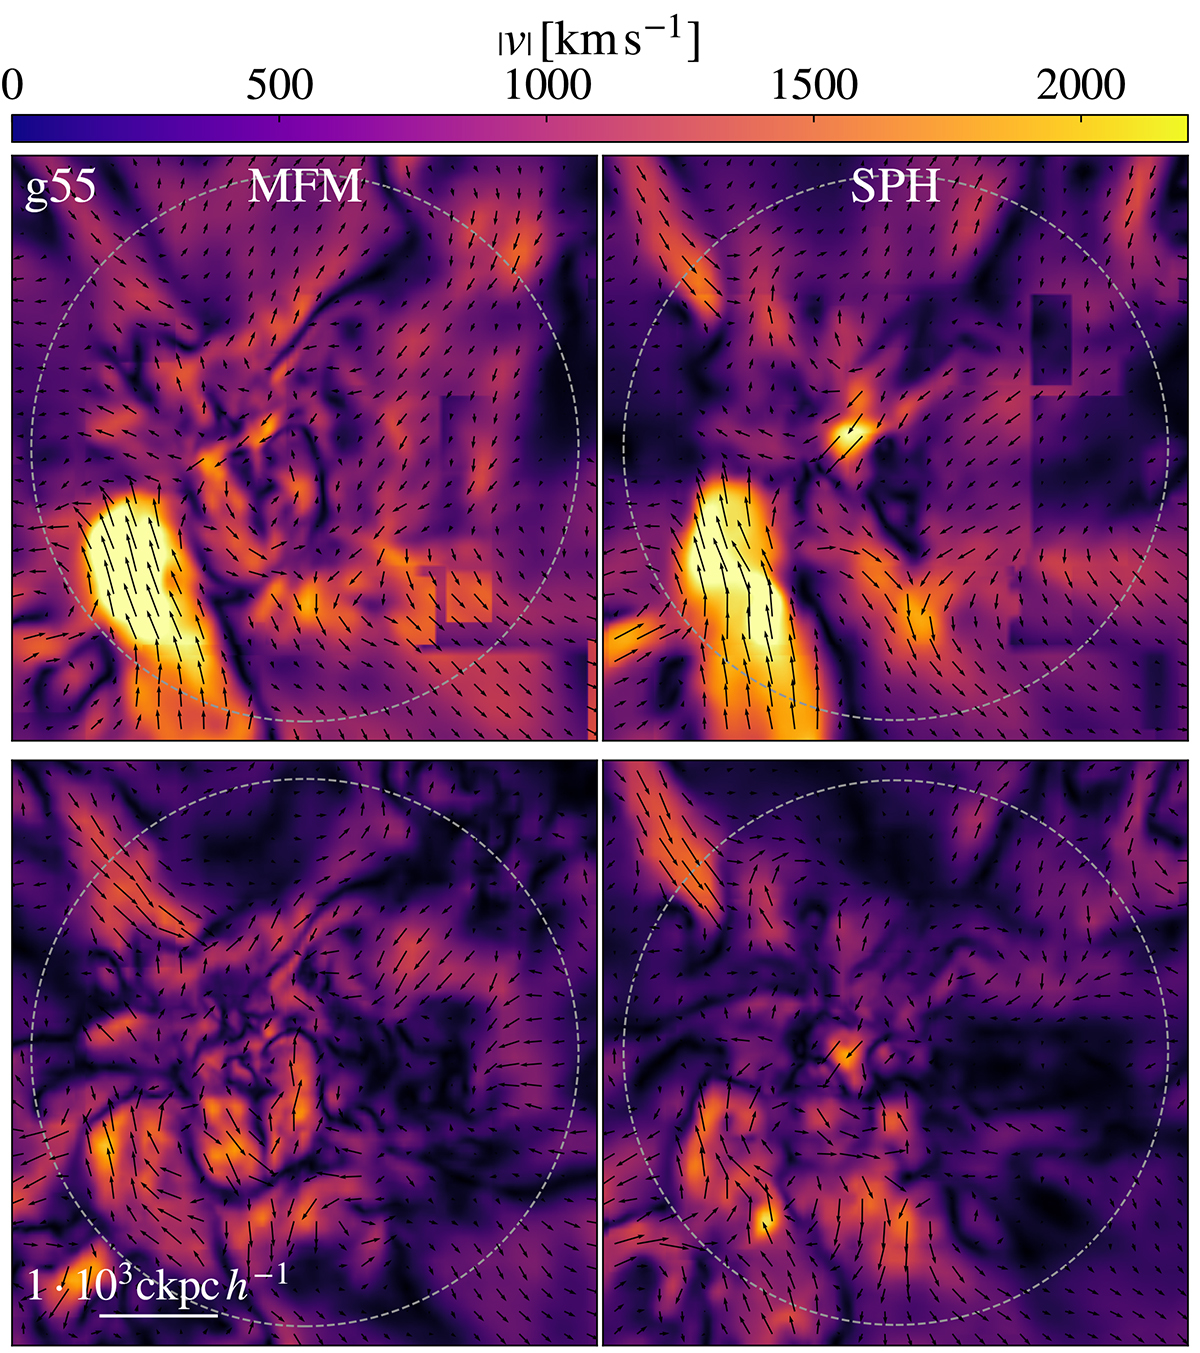
Fig. 5.
Download original image
Slice through the g55 cluster at redshift z = 0, showing the rotational component of the velocity in the upper panel and the multi-scale filtered velocity in the lower panel, each comparing MFM and SPH. The color indicates the absolute value of the solenoidal or filtered velocity, while the quivers show the direction. The dashed circle marks Rvir.
Current usage metrics show cumulative count of Article Views (full-text article views including HTML views, PDF and ePub downloads, according to the available data) and Abstracts Views on Vision4Press platform.
Data correspond to usage on the plateform after 2015. The current usage metrics is available 48-96 hours after online publication and is updated daily on week days.
Initial download of the metrics may take a while.