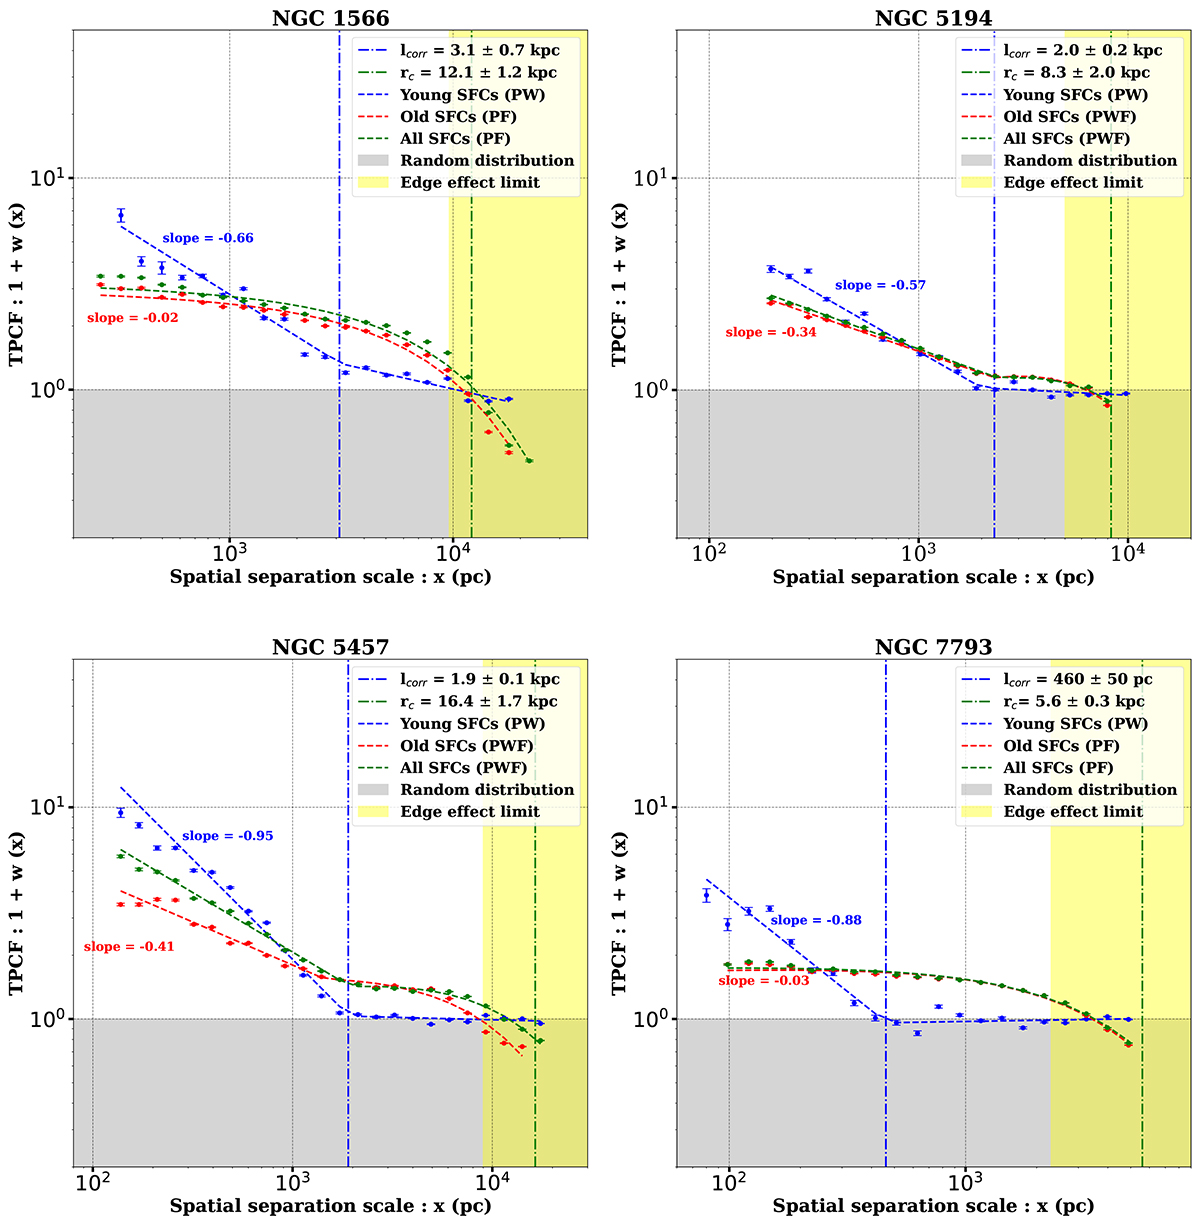
Fig. 5.
Download original image
Two-point correlation function (TPCF) as a function of spatial separation scale for the sample galaxies is shown in this figure for young (< 10 Myr), old (> 10 Myr) and all (young + old) SFCs. The mathematical models describing the observed TPCF plots (Section 5) for a given population of SFCs are mentioned in the brackets. The hierarchy parameters such as lcorr and rc are also marked by dash-dotted blue and green lines. The slope of the TPCF plots for the young and old SFC distributions is quoted in blue and red colour, respectively. The shaded grey region has TPCF < 1 where the distribution of SFCs can be considered as Poissonian. The shaded yellow region represents the edge effect limit beyond which TPCF needs careful interpretation. This limit is equal to 1/5th of the largest separation between any two SFCs in the galaxy. The UVIT resolution limit for the galaxies is 25−130 pc and it is much smaller than the smallest separation seen in the TPCF plots of each galaxy.
Current usage metrics show cumulative count of Article Views (full-text article views including HTML views, PDF and ePub downloads, according to the available data) and Abstracts Views on Vision4Press platform.
Data correspond to usage on the plateform after 2015. The current usage metrics is available 48-96 hours after online publication and is updated daily on week days.
Initial download of the metrics may take a while.