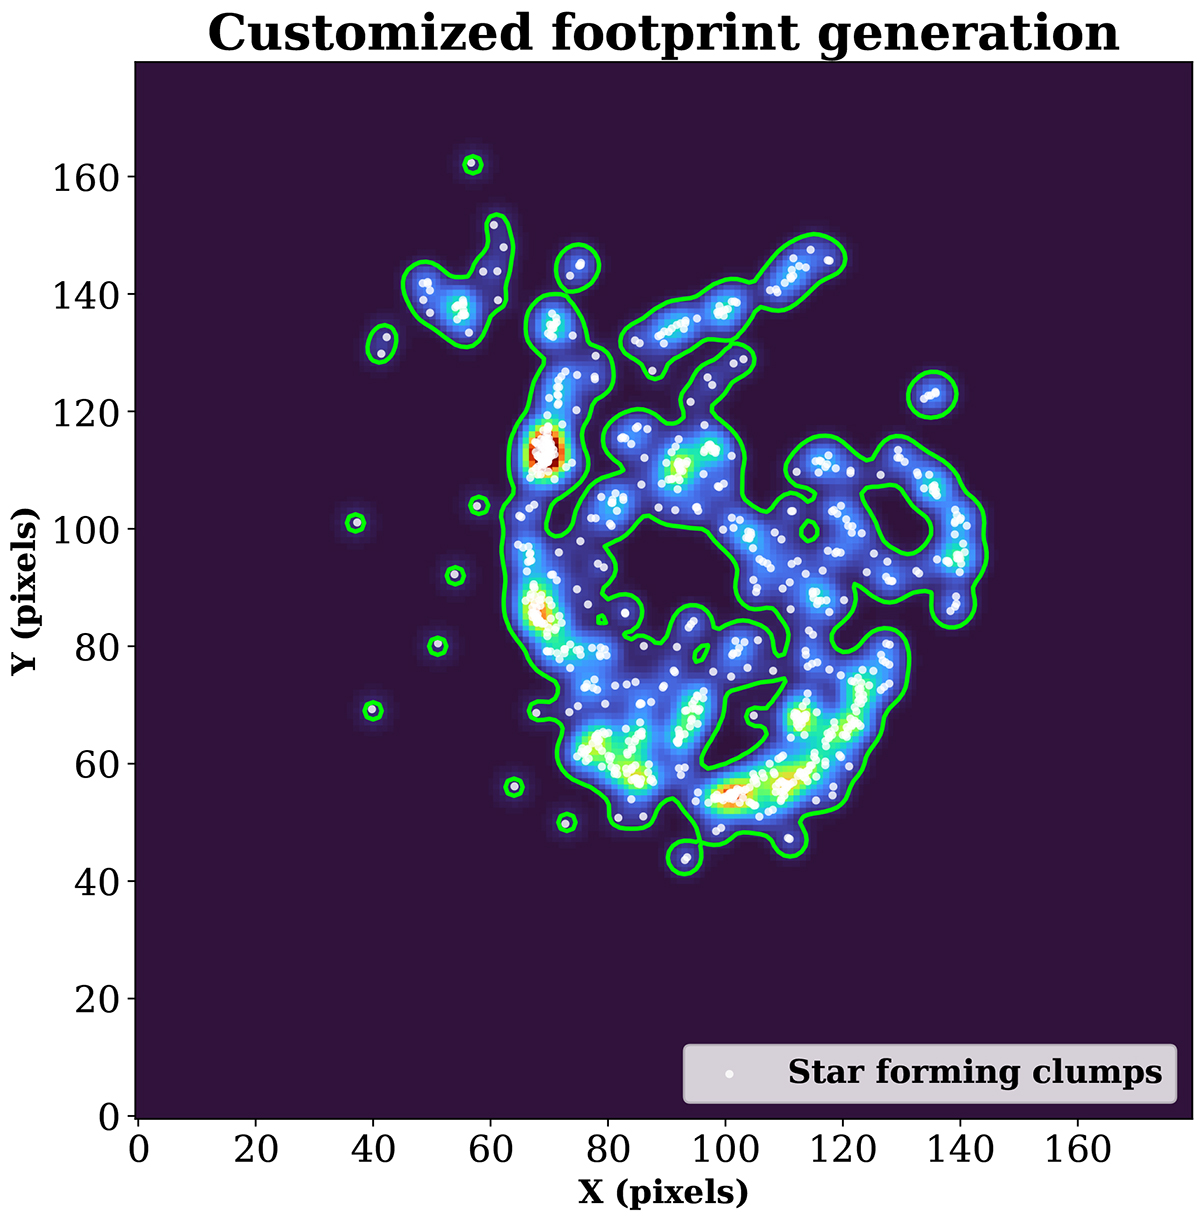
Fig. 4.
Download original image
Schematic describing how the customised footprint for TPCF computation is generated using the positions of young SFCs in NGC 5457. The background image over which the contours are drawn is a 180 × 180 pixel number density map of the SFC distribution. The white dots represent individual SFCs and the green contours mark the customised footprint of the SFC distribution within which random data points need to be populated for the TPCF calculation. See Section 4.6 for more details.
Current usage metrics show cumulative count of Article Views (full-text article views including HTML views, PDF and ePub downloads, according to the available data) and Abstracts Views on Vision4Press platform.
Data correspond to usage on the plateform after 2015. The current usage metrics is available 48-96 hours after online publication and is updated daily on week days.
Initial download of the metrics may take a while.