Fig. 1.
Download original image
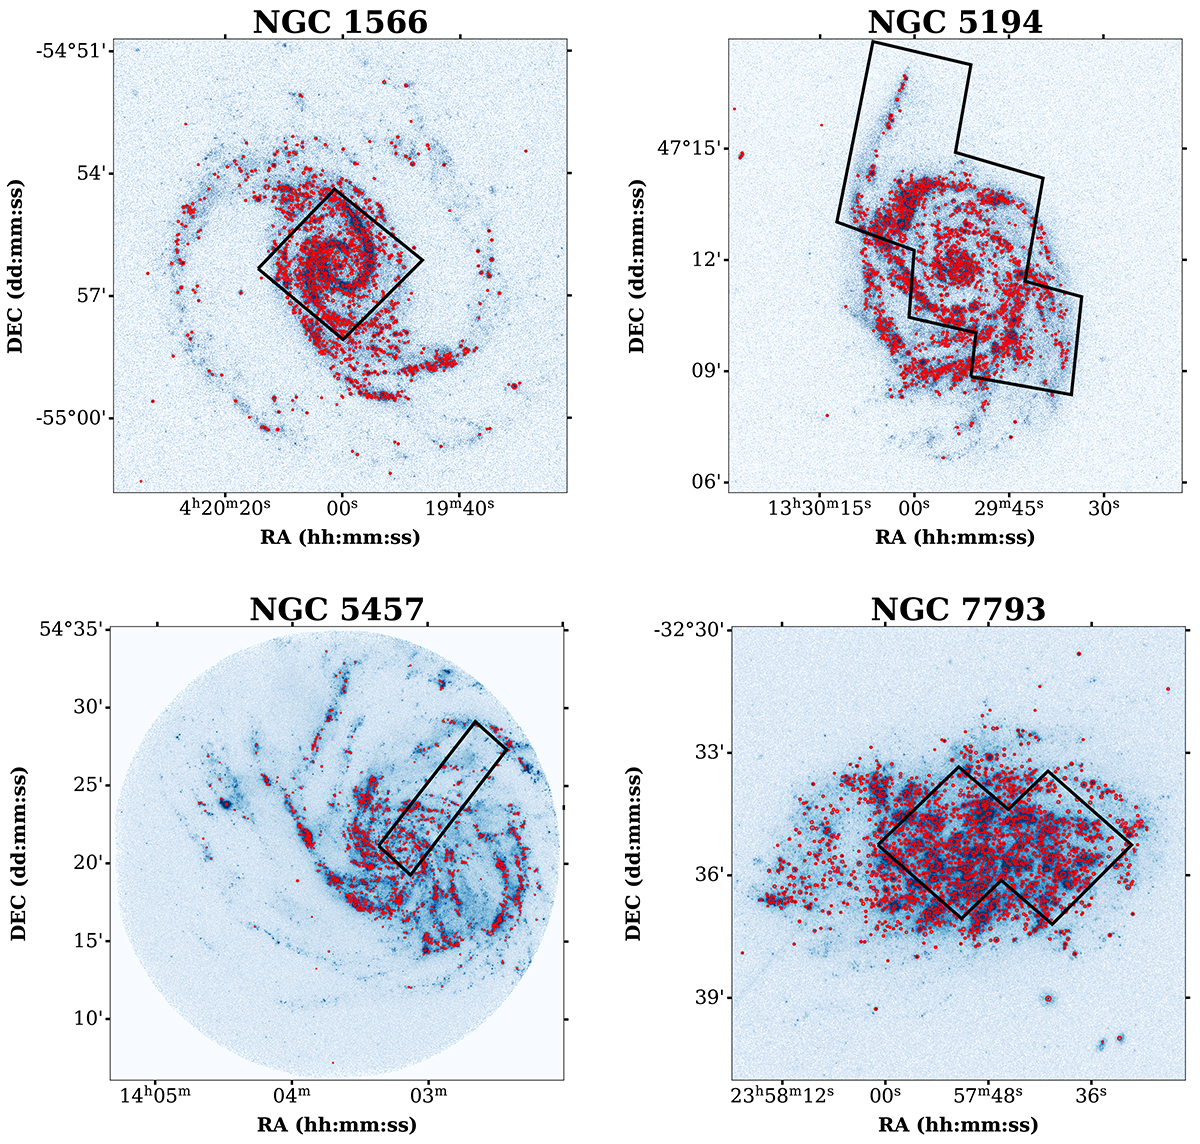
UVIT FUV images of the four galaxies in our sample. The red circles represent the locations and sizes of the SFCs in the galaxies that were detected using astrodendro and the black polygons represent part of the galaxy area that was previously observed using the HST and used in M21. Due to its large FoV, UVIT is able to cover the entire galaxy and it provides an advantage over an instrument like the HST.
Current usage metrics show cumulative count of Article Views (full-text article views including HTML views, PDF and ePub downloads, according to the available data) and Abstracts Views on Vision4Press platform.
Data correspond to usage on the plateform after 2015. The current usage metrics is available 48-96 hours after online publication and is updated daily on week days.
Initial download of the metrics may take a while.