Fig. 9.
Download original image
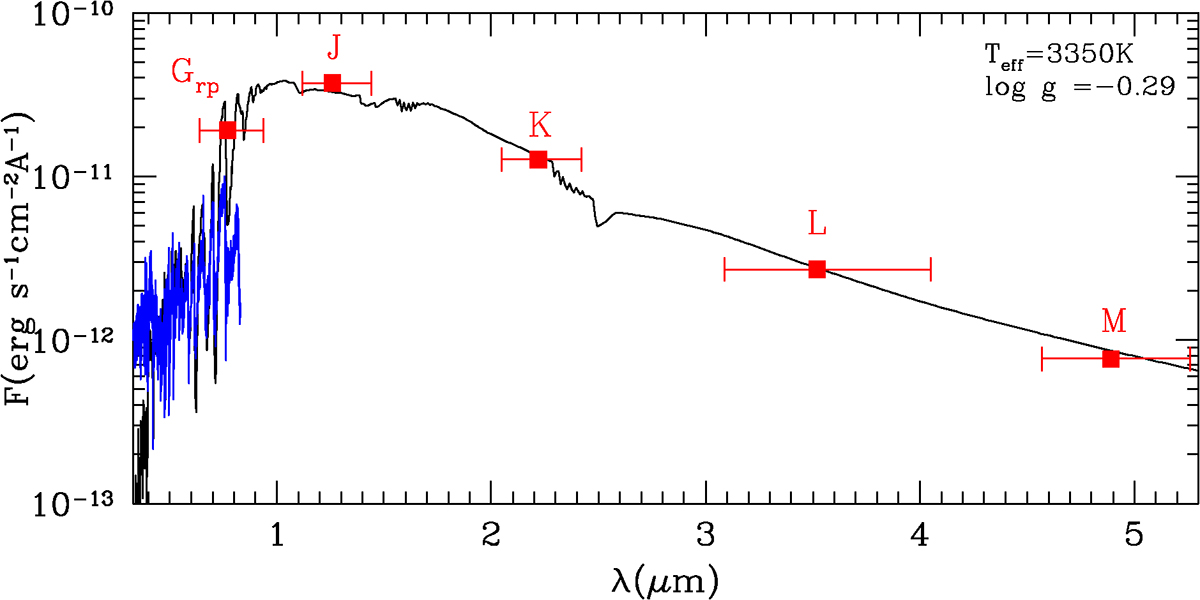
INT IDS visual spectrum (blue) and near-IR flux densities (red squares) calculated from the GAIA and DIRBE multi-epoch photometry. The horizontal bars mark the FWHM of the broadband filters. All data were corrected for extinction assuming AV = 0.8 and the extinction law by Cardelli et al. (1989). The black curve represents the best-fit synthetic spectrum from the library of Lejeune et al. (1997), and the parameters of the model are shown in the top right corner of the plot.
Current usage metrics show cumulative count of Article Views (full-text article views including HTML views, PDF and ePub downloads, according to the available data) and Abstracts Views on Vision4Press platform.
Data correspond to usage on the plateform after 2015. The current usage metrics is available 48-96 hours after online publication and is updated daily on week days.
Initial download of the metrics may take a while.