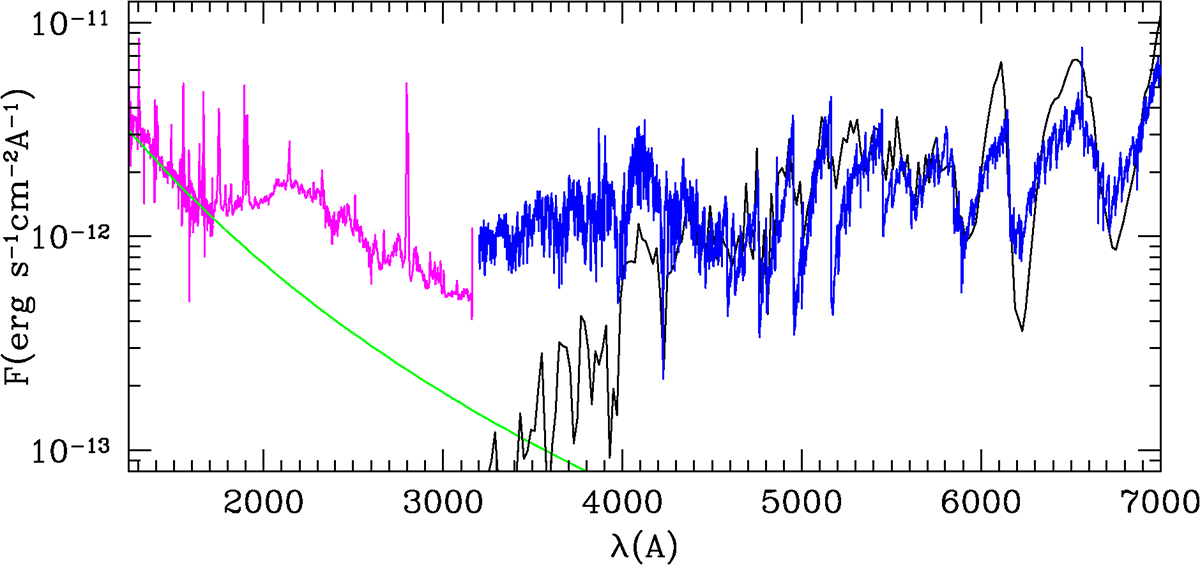
Fig. 8.
Download original image
UV and optical spectra of Y Gem. The figure includes far- and near-UV spectra from HST (magenta) and the optical INT IDS spectrum (blue), both corrected for extinction assuming AV = 0.8 and the extinction curve by Cardelli et al. (1989). The black curve represents the best-fit spectrum from the library of stellar spectra by Lejeune et al. (1997) corresponding to Teff = 3350 K, log g = −0.29, and [Fe/H] = 0.0. The green curve represents a blackbody distribution with Teff = 60 000 K and L = 140 L⊙ (R = 0.11 R⊙).
Current usage metrics show cumulative count of Article Views (full-text article views including HTML views, PDF and ePub downloads, according to the available data) and Abstracts Views on Vision4Press platform.
Data correspond to usage on the plateform after 2015. The current usage metrics is available 48-96 hours after online publication and is updated daily on week days.
Initial download of the metrics may take a while.