Open Access
Fig. 7.
Download original image
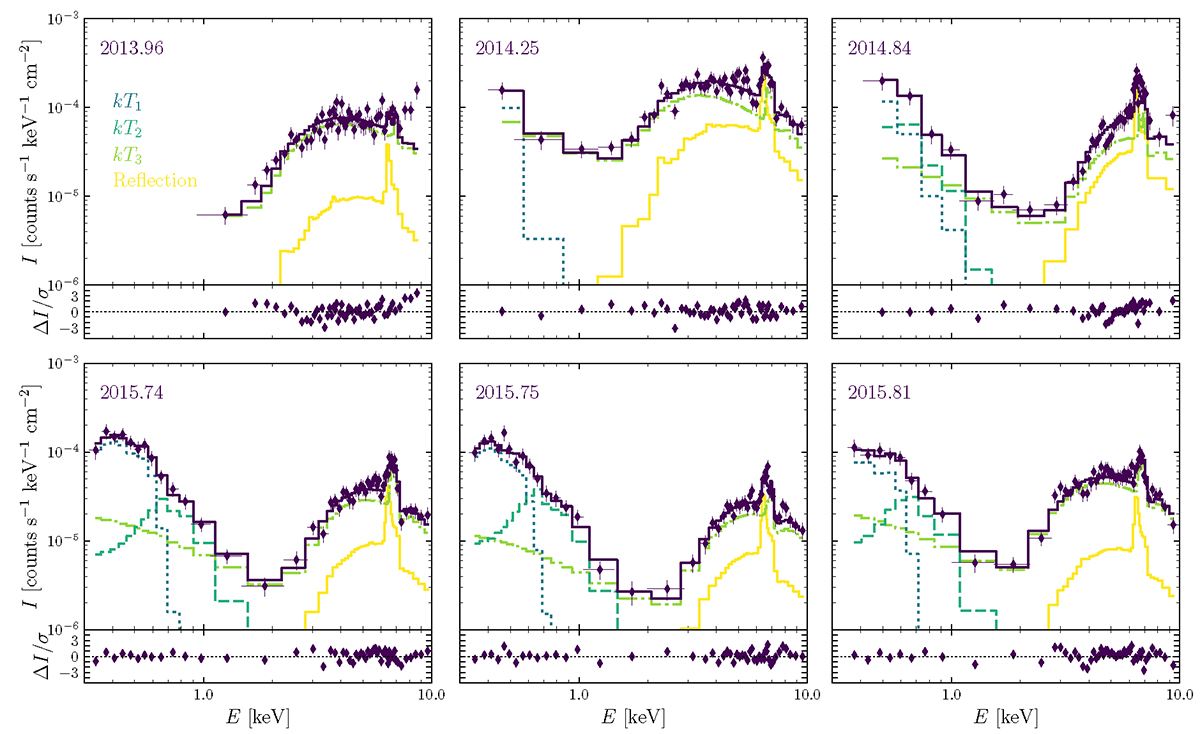
Background-subtracted X-ray spectra of Y Gem. The different panels show different epochs with details from their best-fit model spectra (dark solid line). The dotted, dashed, dash-dotted, and light solid lines represent the contributions from the kT1, kT2, kT3, and the reflection components as described in Table 4.
Current usage metrics show cumulative count of Article Views (full-text article views including HTML views, PDF and ePub downloads, according to the available data) and Abstracts Views on Vision4Press platform.
Data correspond to usage on the plateform after 2015. The current usage metrics is available 48-96 hours after online publication and is updated daily on week days.
Initial download of the metrics may take a while.