Open Access
Fig. 5.
Download original image
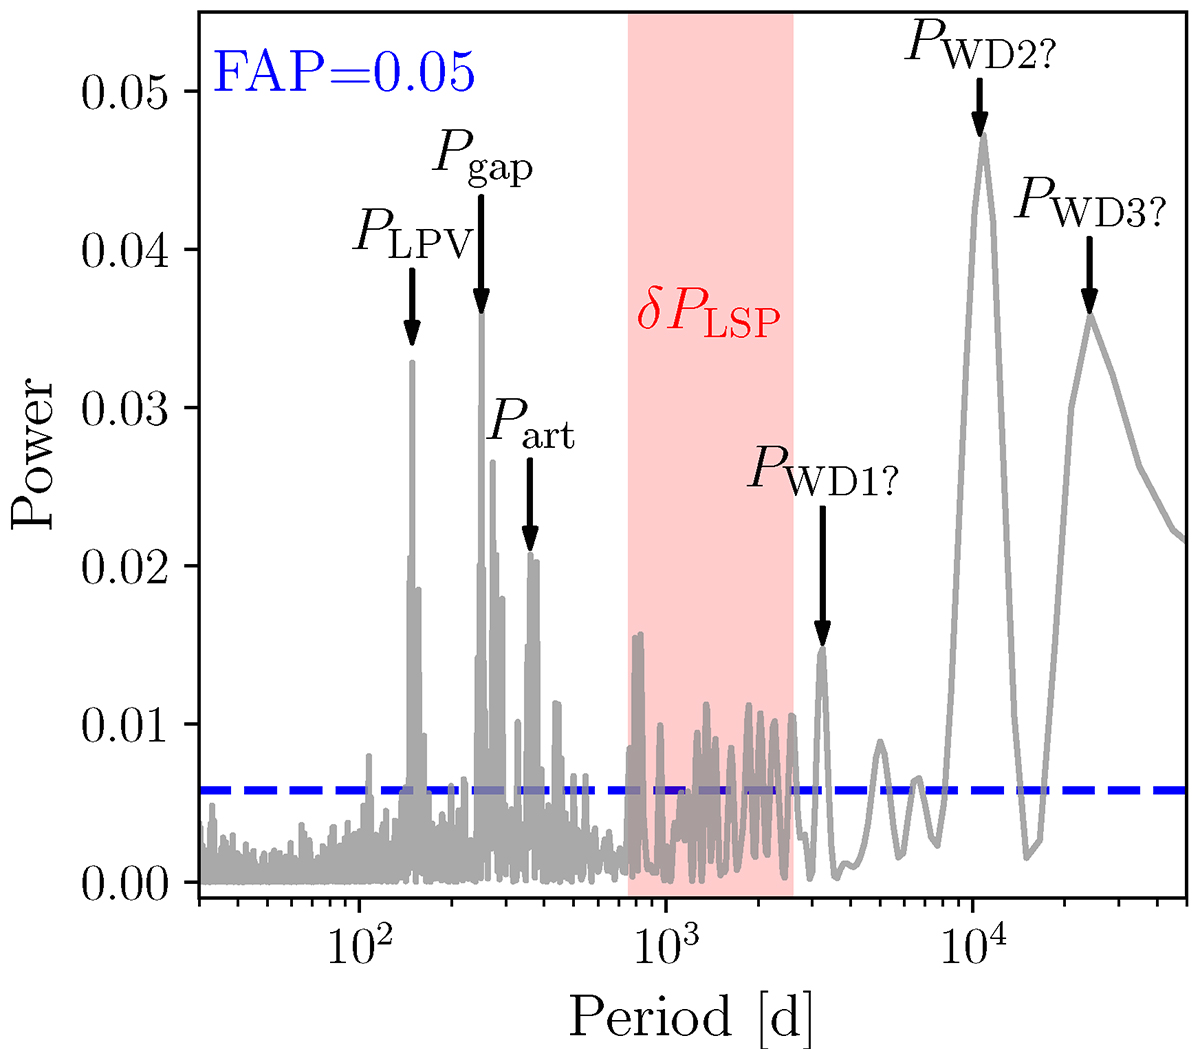
Power spectrum of the visual band light curve from AAVSO. The peaks with significant power values are classified as a signal, and the peaks below the blue line, indicating the FAP with a probability of 0.05, are classified as noise.
Current usage metrics show cumulative count of Article Views (full-text article views including HTML views, PDF and ePub downloads, according to the available data) and Abstracts Views on Vision4Press platform.
Data correspond to usage on the plateform after 2015. The current usage metrics is available 48-96 hours after online publication and is updated daily on week days.
Initial download of the metrics may take a while.