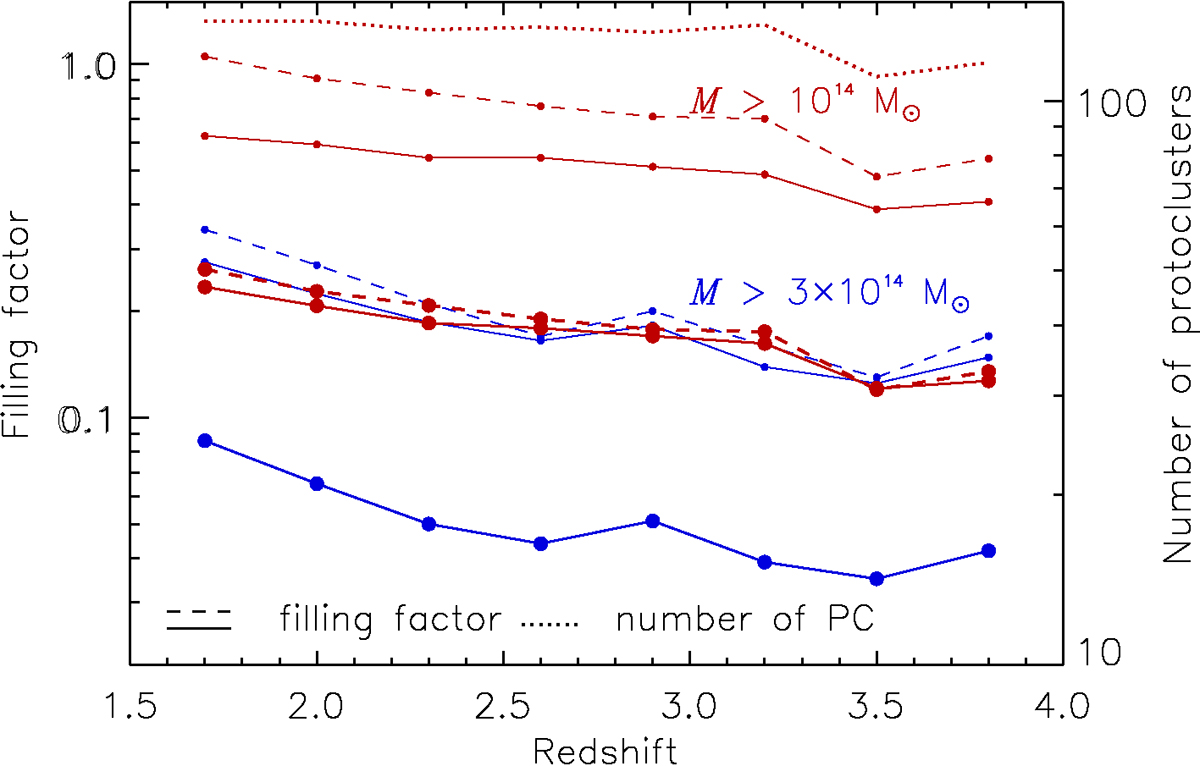
Fig. 23.
Download original image
Number of MAMBO proto-clusters and the sky-filling factor in a Δz (50%) redshift interval as a function of redshift and proto-cluster mass limit. The numbers are only shown for the sample with Mpc ≥ 1014 M⊙ as a dotted line. Solid lines show the fraction of the sky covered by the proto-clusters, and the dashed lines display the combined sky area of the proto-clusters. The thick lines with larger data points show the results for the core regions, while the thin lines show those for the region out to rpc. For the core regions of the Mpc ≥ 3 × 10¹⁴ M⊙ proto-clusters, the dashed and solid lines overlap.
Current usage metrics show cumulative count of Article Views (full-text article views including HTML views, PDF and ePub downloads, according to the available data) and Abstracts Views on Vision4Press platform.
Data correspond to usage on the plateform after 2015. The current usage metrics is available 48-96 hours after online publication and is updated daily on week days.
Initial download of the metrics may take a while.