Open Access
Fig. A.2
Download original image
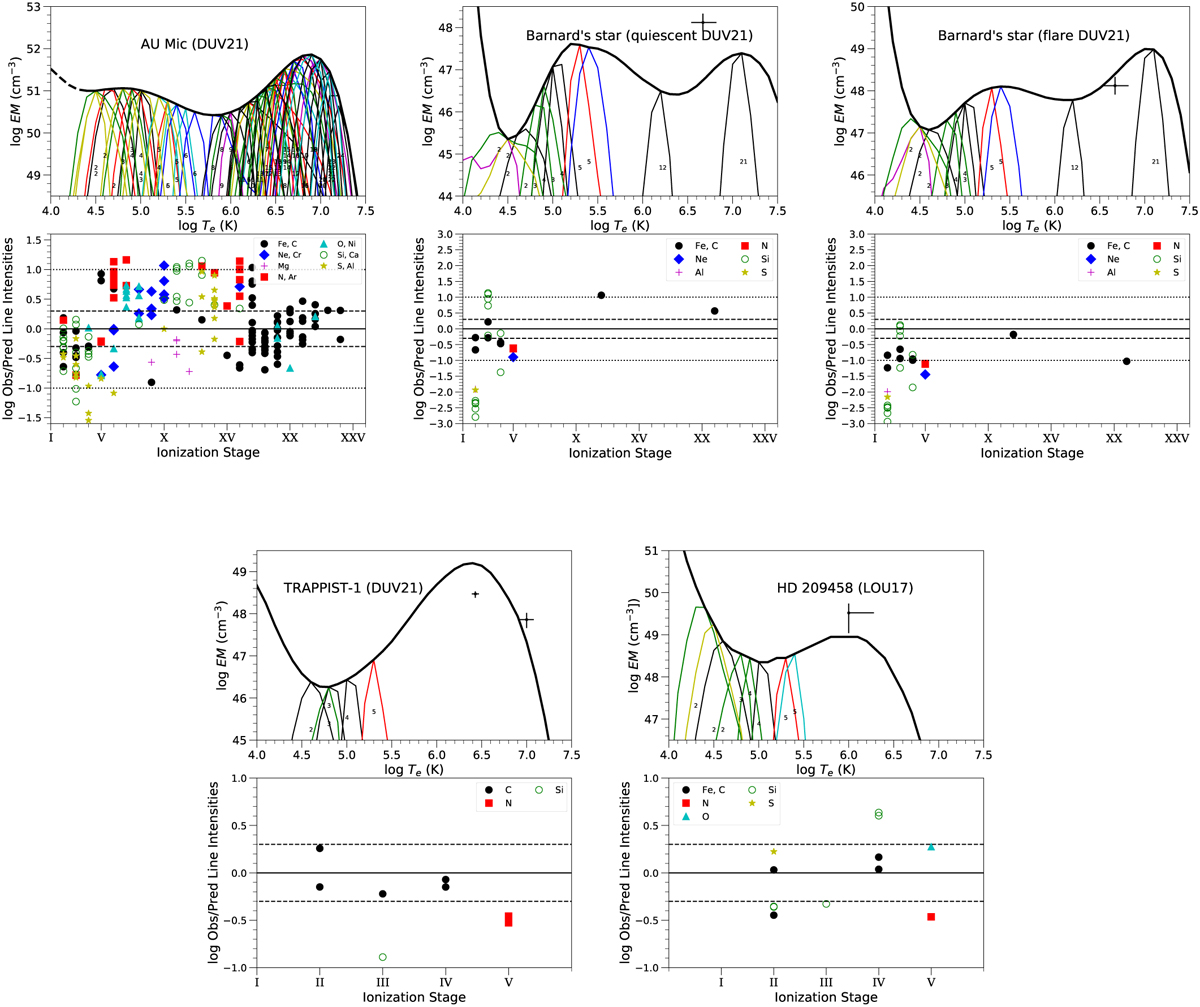
EMDs calculated from the DEM published in LOU17 and DUV21, using our line fluxes measurements to test the quality of the fit. Symbols and lines as in Fig. 1. In the lower panels the axis range has been adapted to show all available line fluxes ratios. An offset of one order of magnitude is indicated with dotted lines.
Current usage metrics show cumulative count of Article Views (full-text article views including HTML views, PDF and ePub downloads, according to the available data) and Abstracts Views on Vision4Press platform.
Data correspond to usage on the plateform after 2015. The current usage metrics is available 48-96 hours after online publication and is updated daily on week days.
Initial download of the metrics may take a while.