Fig. 4
Download original image
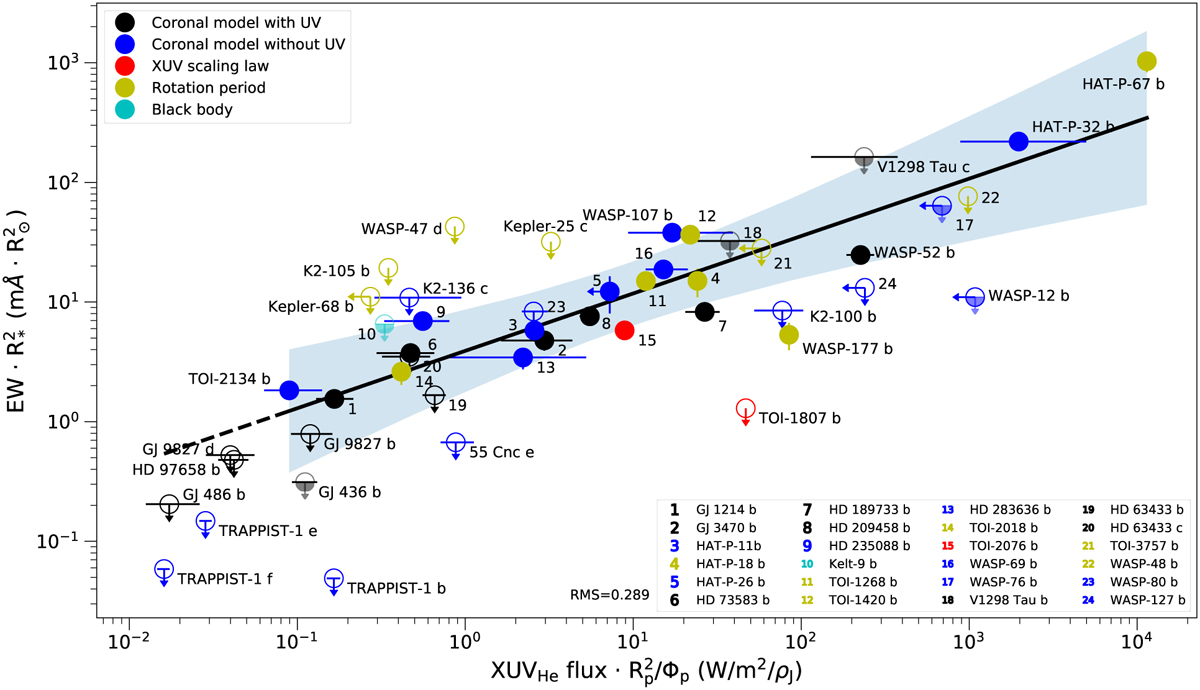
He I 10 830 triplet equivalent width, multiplied by the stellar area, plotted against FXUV,He, weighted by ![]() , i.e., by the planet density. The 1σ error bands to the fit, calculated only with positive detections (filled symbols), are displayed in light blue. Different colors indicate the method used to calculate the XUV flux in the 5–504 Å range (see Sect. 4.4). Half-filled symbols are used for the equivalent width upper limits calculated by our team, while those calculated by other authors are shown in open symbols.
, i.e., by the planet density. The 1σ error bands to the fit, calculated only with positive detections (filled symbols), are displayed in light blue. Different colors indicate the method used to calculate the XUV flux in the 5–504 Å range (see Sect. 4.4). Half-filled symbols are used for the equivalent width upper limits calculated by our team, while those calculated by other authors are shown in open symbols.
Current usage metrics show cumulative count of Article Views (full-text article views including HTML views, PDF and ePub downloads, according to the available data) and Abstracts Views on Vision4Press platform.
Data correspond to usage on the plateform after 2015. The current usage metrics is available 48-96 hours after online publication and is updated daily on week days.
Initial download of the metrics may take a while.